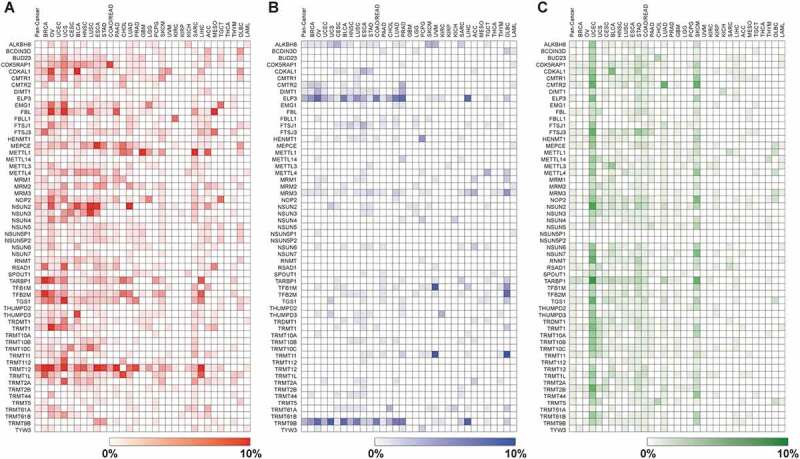
Figure 1.

Heatmap showing the frequencies of (A) RNMT amplification (red), (B) deep deletion (blue) and (C) mutations (green) across all 32 TCGA tumour types. Heatmap was generated using Morpheus software from the Broad Institute (https://software.broadinstitute.org/morpheus/) .
