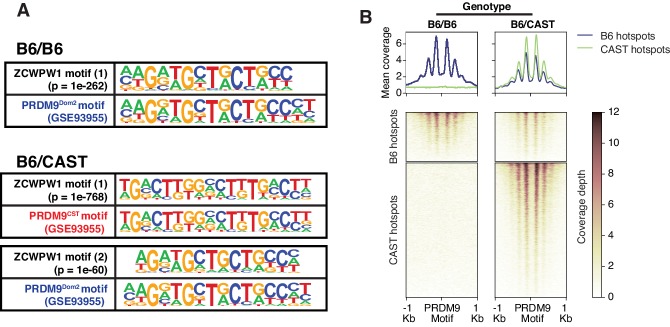
Figure 4. Mapping of ZCWPW1 chromatin biding in vivo using CUT&RUN in spermatocytes from F1 B6/CAST hybrid mice.
(A) Comparisons of de novo discovered motifs for PRDM9Dom2, PRDM9Cast and ZCWPW1. For PRDM9Dom2 and PRDM9Cast, PRDM9 ChIP-seq peaks (GSE93955) for either allele were queried by HOMER to identify the consensus DNA motif for their binding sites. For ZCWPW1, CUT&RUN peaks from either B6/B6 or B6/CAST F1 hybrid were used to identify ZCWPW1 binding motifs in pure and mixed genomic backgrounds, respectively. The first motif hit is shown for binding in B6/B6 and the first and second hits are shown for B6/CAST. (B) Heatmaps comparing ZCWPW1 read coverage for CUT&RUN performed in spermatocytes from either B6/B6 or B6/CAST F1 hybrid. ZCWPW1 signal is plotted around F1 hybrid hotspots defined by DMC1 SSDS (GSE73833) and regions categorized based on PRDM9 allele motif in the center of the hotspot (Prdm9Dom2 and Prdm9Cast for B6 and CAST strains respectively). Signals are centered around PRDM9 motifs, and hotspots with multiple motifs were excluded from plotting (10,466 DSB hotspots from B6xCAST F1 were used in total). Y-axis of line plots in the top represents mean coverage (trimmed fragments/50 bp).


