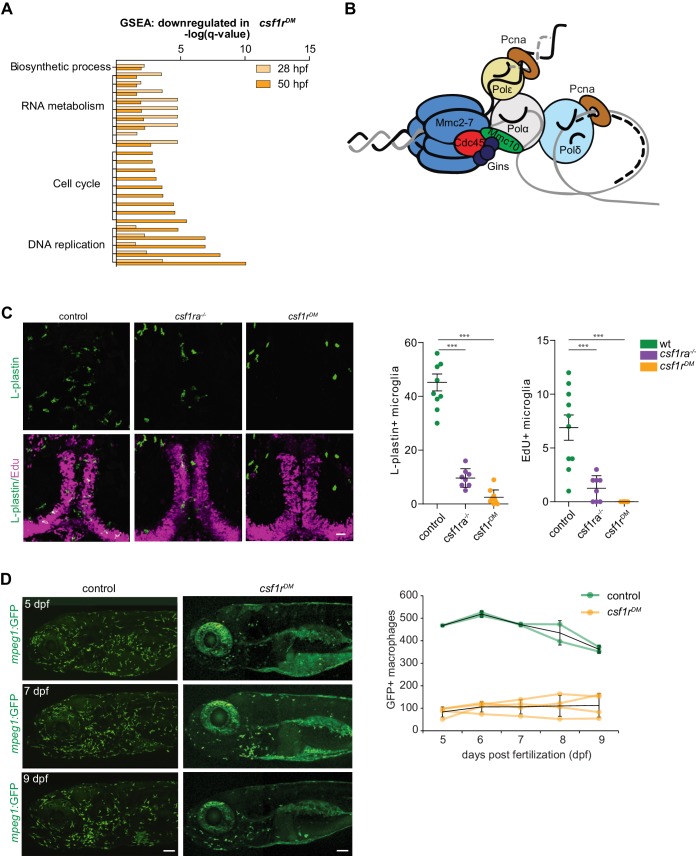
Figure 3. Csf1r-deficient tissue resident macrophages (microglia) fail to proliferate.
(A) Bar graph showing the GO terms associated with enriched genes downregulated in csf1rDM macrophages (p<0,05). (B) Cartoon representing the vertebrate DNA replication complex, all components were significantly downregulated in csf1rDM macrophages. (C) Representative images and quantification of L-plastin/Edu double positive microglia at 5 dpf. Scale bar represents 25 µM. (D) Representative images, and quantification, of mpeg1+ macrophages in the anterior part of 5, 7 and 9 day old zebrafish and quantification of total number of macrophages at the imaged half of the total embryo. Mpeg1+ cells were quantified on one side of the embryo (right side). Error bars represent standard deviation. Statistical significance is calculated using one-way ANOVA with Dunnett’s multiple comparison test *<0,05 **<0,01 ***<0001. Each dot represents one fish.

