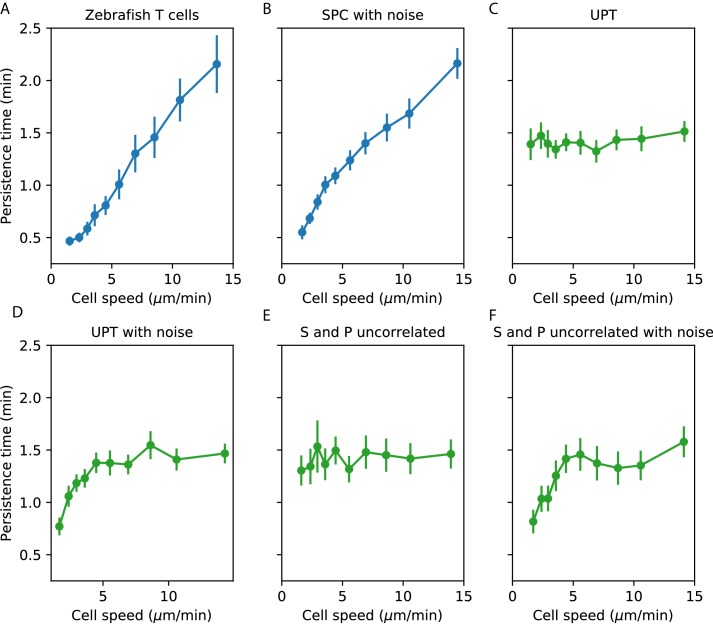
Appendix 1—figure 1. Comparisons between speed-persistence time relationship in simulations and data.
(A) Data (as in Figure 4A). (B) Simulation of the SPC model with empirical parameters (see Appendix 1 for details). (C) Simulation of uniform persistence time (UPT) model, with speeds and persistence times measured as in the data. Biases introduced by measured speeds and persistence times do not lead to an observable correlation. (D) Simulation of UPT model with a conservative estimate of mislocation noise. A spurious correllation is induced at low cell speeds, but cannot account for the trend across cell speeds that we observe. (E) Simulation of a model where the predicted persistence times have been reshuffled amongst the cells, to simulate an empirically-realistic model where persistence times vary but are uncorrelated with speed. This does not generate a significant bias in the speed-persistence relationship. (F) Model with reshuffled persistence times, as in E., and mislocation noise. As in D., this leads to a spurious correlation at low speeds but no other significant effects.

