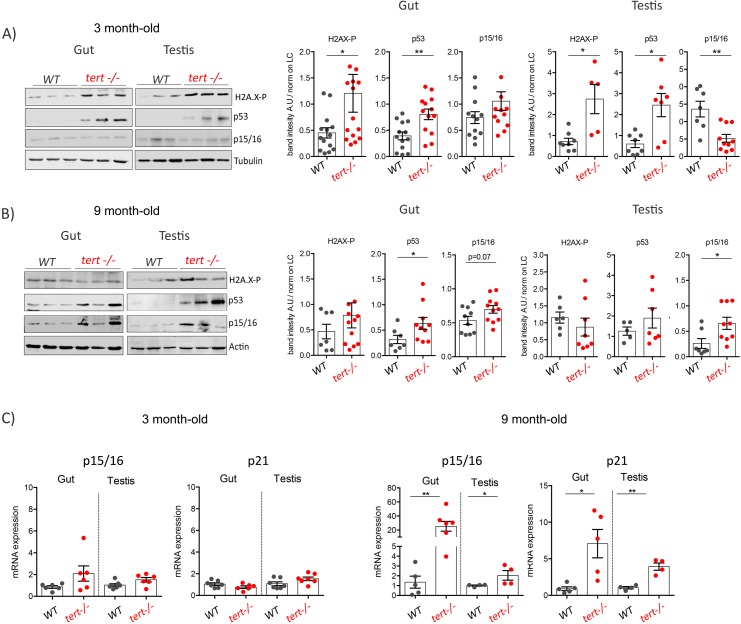
Figure 2. Quantification of senescence markers in gut and testis of older tert-/- zebrafish.
(A-B) Western blot analysis of DNA damage and senescence-associated proteins in gut and testis of 3 month (A) or 9-month-old (B) of WT and tert-/- siblings (N >= 5 fish). Representative western blot (left panel) and corresponding quantification (right panel) showing induction of DNA Damage Response (H2A.X-P and p53) in 3-month-old and senescence (p15/16) in 9-month-old tert-/- zebrafish. (C) RT-qPCR analysis of senescence associated genes p15/16 and p21. RT-qPCR graphs are representing mean ± SEM mRNA fold increase after normalisation by rpl13a gene expression levels (* p-value<0.05; ** p-value<0.01, using the Mann-Whitney test).

