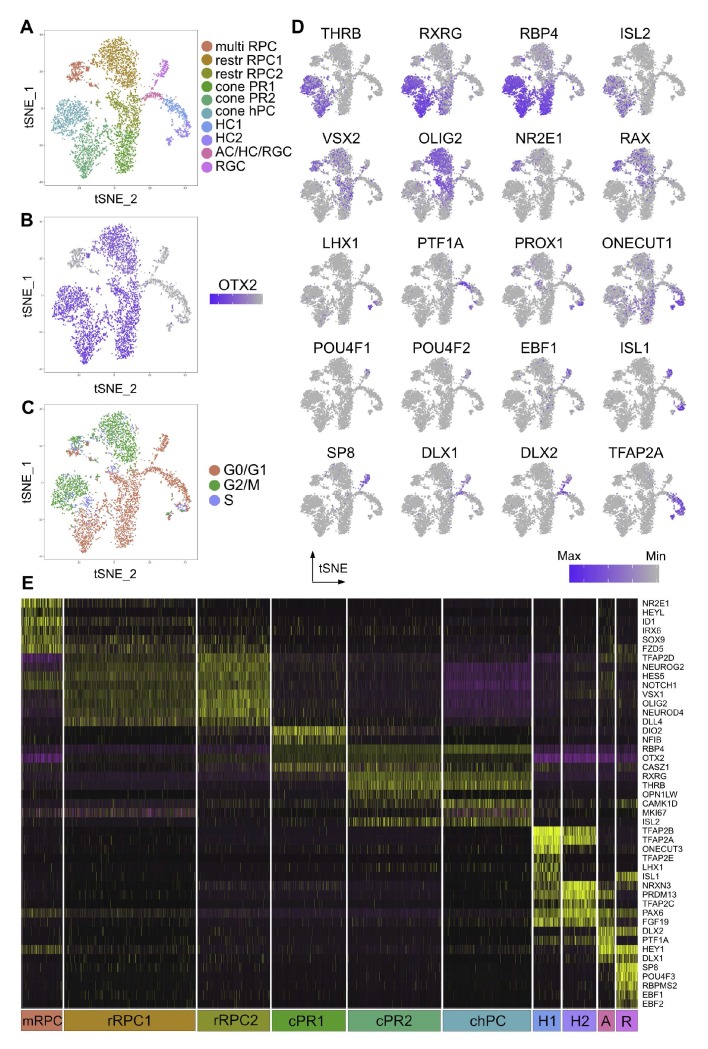
Figure 4. Single cell analysis of CTRL OTX2ECR2::GFP cells.
(A) TSNE plots of the 10 clusters generated by the unsupervised algorithm Seurat, based on the gene expression of each cell analyzed. (B) Heatmap of OTX2 expression (purple) in the cells analyzed. (C) TSNE plots of the clusters showing their cell cycle state, G1, G2M or S-phase. (D) Heatmaps showing the expression of different markers in the 10 clusters, in TSNE view. (E) Heatmap of differentially expressed genes across the 10 clusters, where purple represents low gene expression and yellow represents high expression. MultiRPC – multipotent RPC, restrRPC – restricted RPC.

