. 2020 Apr 29;9:e54279. doi: 10.7554/eLife.54279

Figure 5. Combined single cell analysis from CTRL and OTX2CRISPR retinas labeled by OTX2ECR2::GFP reporter.

TSNE plots of the two datasets analyzed simultaneously (A) and labeled for their cell cycle signature (B). (C) TSNE plots of the 10 clusters determined by Seurat - multipotent RPCs (multiRPC), restricted RPCs (restrRPC), cone PR1 and 2, cone homotypical PC, HC clusters (HC1 and HC2), RGC, AC/HC/RGC and New, in the CTRL (left) and mutant (right) samples. (D) Heatmap of OTX2 expression across the two datasets. (E) Differentially expressed genes in the CTRL and OTX2CRISPR cells showing average reads per cell. (F) Pie charts showing the percentages of cells found in each cluster of the CTRL and mutant samples. Bars under the pie charts show distribution of cell cycle markers across the two datasets. (G) Heatmap of the differentially expressed genes across the clusters of both CTRL and OTX2CRISPR cells. Purple represents low gene expression and yellow represents high expression.

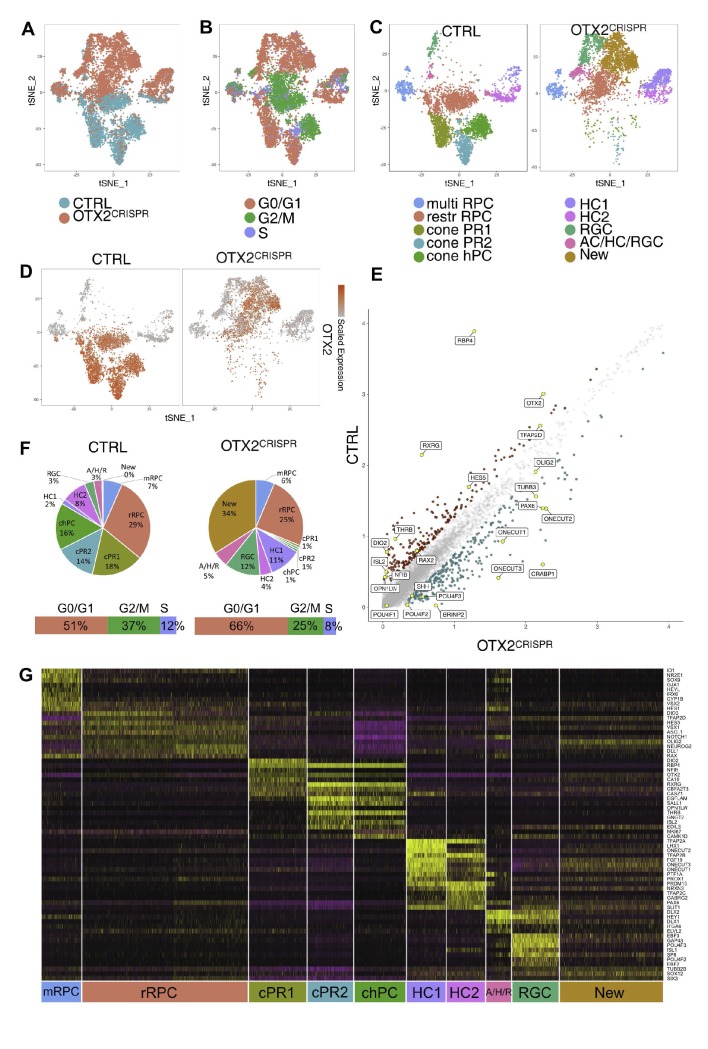
Figure 5.

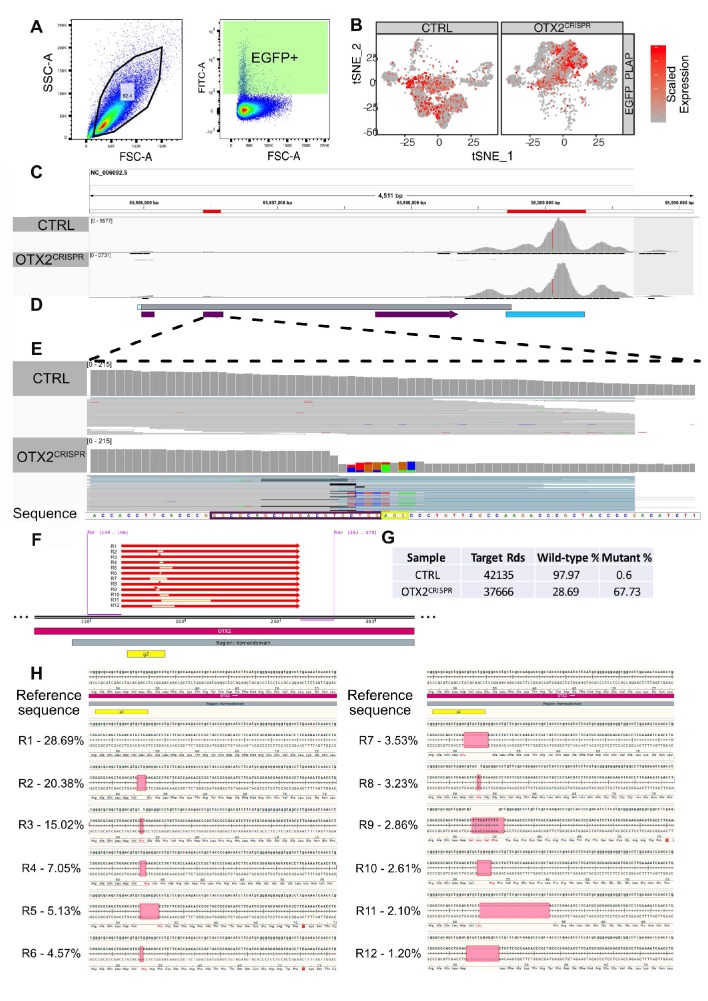
Figure 5—figure supplement 1. GFP collection gates, expression in the clustered cells and validation of the CRISPR-induced mutations in the analyzed mutant retinas.

Figure 5—figure supplement 1.

(A) Flow cytometry plots showing the collection gates for the cells sorted prior to single cell library preparation. (B) Heatmap of GFP_IRES_PLAP reporter expression across both single cell datasets. (C) Analysis of the OTX2 reads aligned to the Gallus gallus genome, GRC6 assembly GCF_000002315.5) using IGV (Integrative Genomics Viewer) view of the OTX2 locus. First red box represents the second coding exon, while the last one represents the 3’ end of the gene. The majority of the reads are located at the 3’end, due to the specifics of the library preparation technique. (D) Aligned sequencing reads mapped to the OTX2 sequence. Bright blue box – 5’UTR, first grey box – OTX2 gene block, last grey box – 3’UTR. Purple boxes represent the exons. Turquoise box represents 3’ most region, with high number of reads aligned. (E) Increased magnification of the second coding exon. Grey vertical bars represent the reads aligned to that region of the gene. Purple box around the sequence highlights the Cas9 target DNA and the yellow box highlights the PAM motif. Colored vertical blocks in the OTX2CRISPR alignment represent the mismatches identified in the aligned reads; black horizontal fine lines show deletions of the aligned reads. (F) Summary of the amplicon deep sequencing results (right) and mapped reads to the amplified region; For, Rev primers used for the amplification of the sequence; g2, guide 2. (G–H) Quantification and detailed view of the mutations, including their impact on the reading frame. R, reads. The remaining reads (in table (G)), up to 100% from the total - 3.58% in the OTX2CRISPR and 1.43% in CTRL represent noisy reads.
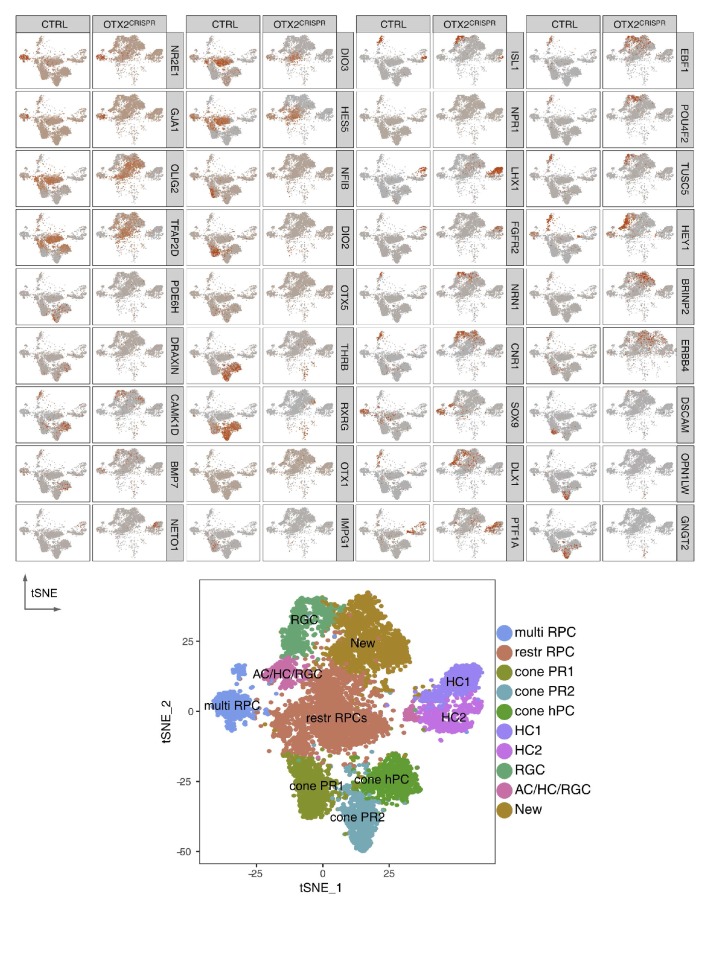
Figure 5—figure supplement 2. Representative markers for each cluster in CTRL and OTX2CRISPR samples.

Figure 5—figure supplement 2.

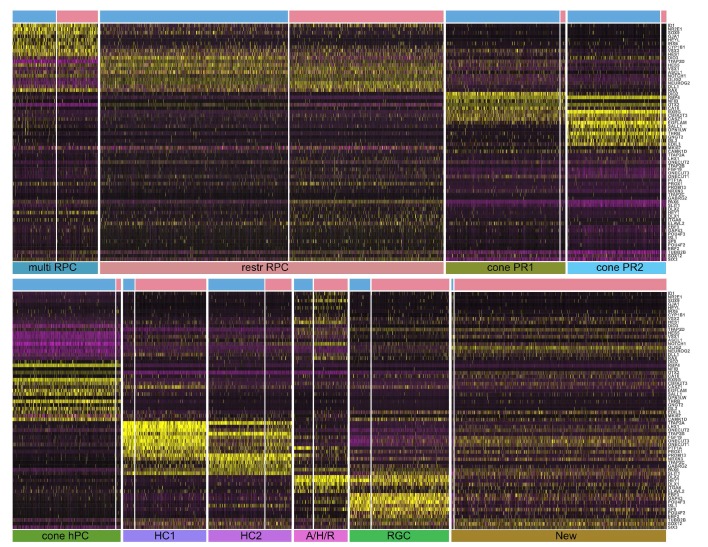
Figure 5—figure supplement 3. Heatmap of the differentially expressed genes across the clusters of both CTRL and OTX2CRISPR cells.

Figure 5—figure supplement 3.

Differentially expressed genes are presented in a CTRL (blue bar above heatmap) vs OTX2CRISPR (pink bar above heatmap) comparison and scaled from the lowest expressed gene to the highest per cluster. Each cluster is represented below heatmaps. Within heatmaps, purple represents low gene expression and yellow represents high expression.