. 2020 May 12;9:e54818. doi: 10.7554/eLife.54818

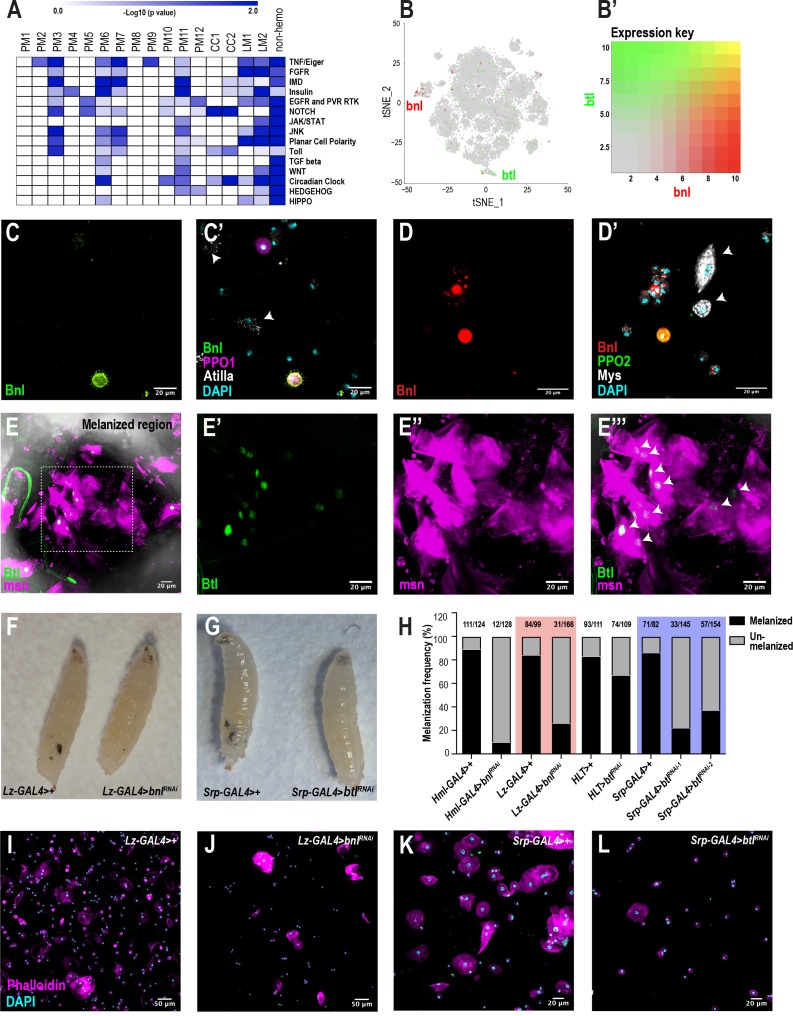
Figure 6. scRNA-seq uncovers a novel role for the FGF pathway in immune response.

(A) Pathway enrichment of the top marker genes across all the clusters from Figure 1C. (B) Expression of bnl (red) and btl (green) in crystal cell and lamellocyte clusters, respectively. (B’) Expression heat map key. (C, C’) Validation of bnl expression in hemocytes of wounded bnl-LexA; LexAOp-myr-GFP, BcF6-mCherry larvae. Expression of GFP was detected only in crystal cells and not lamellocytes (white arrows). GFP and BcF6-mCherry represent the expression of bnl and PPO1, respectively. Scale bar = 20 μm. (D, D’) Validation of bnl expression in hemocytes of wasp infested bnl-LexA; LexAOp-mCherry larvae. Bnl (mCherry+), Bnl+PPO2 (red+green merged), Myospheroid (Mys, which is specific for lamellocytes) (white arrows), DAPI (cyan). Scale bar = 20 μm. (E-E’’’) Validation of btl expression in lamellocytes in vivo. The melanized region of btl-GAL4; UAS-GFPN-lacZ, msn-mCherry larvae was imaged using confocal microscopy. Expression of GFP was detected in LM nuclei (white arrows in E’’’). GFP and msn-mCherry represent the expression of btl and msn, respectively. msn is a marker for lamellocytes. Scale bar = 20 μm. (F) Representative images of wasp inf. 48 hr lz-GAL4>+ (control) and lz-GAL4 >bnlRNAi larvae. (G) Representative images of wasp inf. 48 hr srp-GAL4>+ and srp-GAL4 >btlRNAi larvae. (H) Melanization frequencies of wasp inf. 48 hr larvae upon bnl and btl knockdown using Hml-, lz-, HLT-, and srp-GAL4 drivers. (I, J) Confocal images of hemocytes from wasp inf. 48 hr larvae in lz-GAL4>+ controls (I) compared to their lz-GAL4 >bnlRNAi (J). Scale bar = 50 μm. (K, L) Confocal images of hemocytes from wasp inf. 48 hr larvae in srp-GAL4>+ controls (K) compared to their srp-GAL4 >btlRNAi (L). Scale bar = 20 μm.

Figure 6.

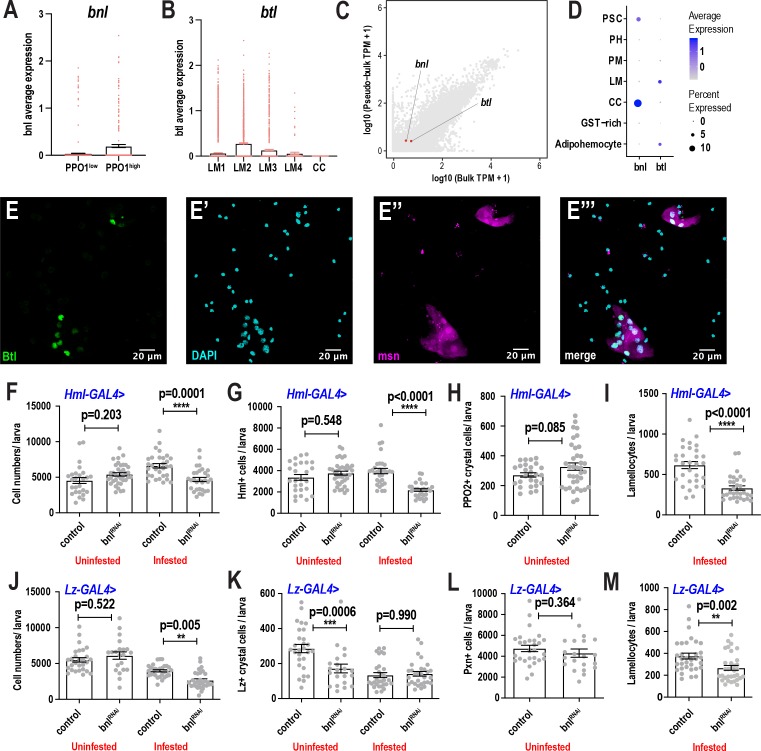
Figure 6—figure supplement 1. scRNA-seq uncovers a novel role for the FGF pathway in immune response.

Figure 6—figure supplement 1.

(A) Average bnl expression counts derived from the crystal cell sub-clustering data revealed that bnl is more enriched in PPO1highcrystal cells. Each colored dot represents one cell. Error bars are represented as ± SEM. (B) Average btl expression counts derived from the lamellocyte sub-clustering data revealed that btl is more enriched in LM2 and LM3 sub-clusters. Each colored dot represents one cell. Error bars are represented as ± SEM. (C) Expression validation of bnl and btl in pseudobulk scRNA- and bulk RNA-seq of lymph glands from unwounded normal larvae. D) Dot plot representing the expression enrichment of bnl in crystal cell (CC) and btl in lamellocyte (LM) clusters of lymph gland scRNA-seq of unwounded control larvae. Clusters GST-rich, PM, PH, and PSC are glutathione S transferase-rich, plasmatocytes, prohemocytes, and posterior signaling center, respectively. (E-E’’’) Validation of btl expression in lamellocytes upon wasp infestation. btl-GAL4; UAS-GFPN-lacZ, msn-mCherry larvae were wasp infested and the hemocytes were bled for subsequent staining of the nuclei using DAPI. Scale bar = 20 μm. (F-I) Bar graphs representing average number of total cells (F), Hml+ cells (G), PPO2+crystal cells (H), and lamellocytes (I) per larva with or without RNAi against bnl using the Hml-GAL4 driver. Comparisons were made between the genotypes in uninfested control and wasp inf. 48 hr conditions. n = 26–37 biological replicates per condition and genotype. (J-M) Bar graphs representing average number of total cells (J), Lz+crystal cells (K), Pxn+ cells (L), and lamellocytes (M) per larva with or without RNAi against bnl using the Lz-GAL4 driver. Comparisons were made between the genotypes in uninfested control and wasp inf. 48 hr conditions. n = 21–31 biological replicates per condition and genotype. Error bars are represented as ± SEM. Statistics were done in Prism 8 using one-way ANOVA. P values are represented by * (p<0.05), ** (p<0.01), *** (p<0.001), **** (p<0.0001).
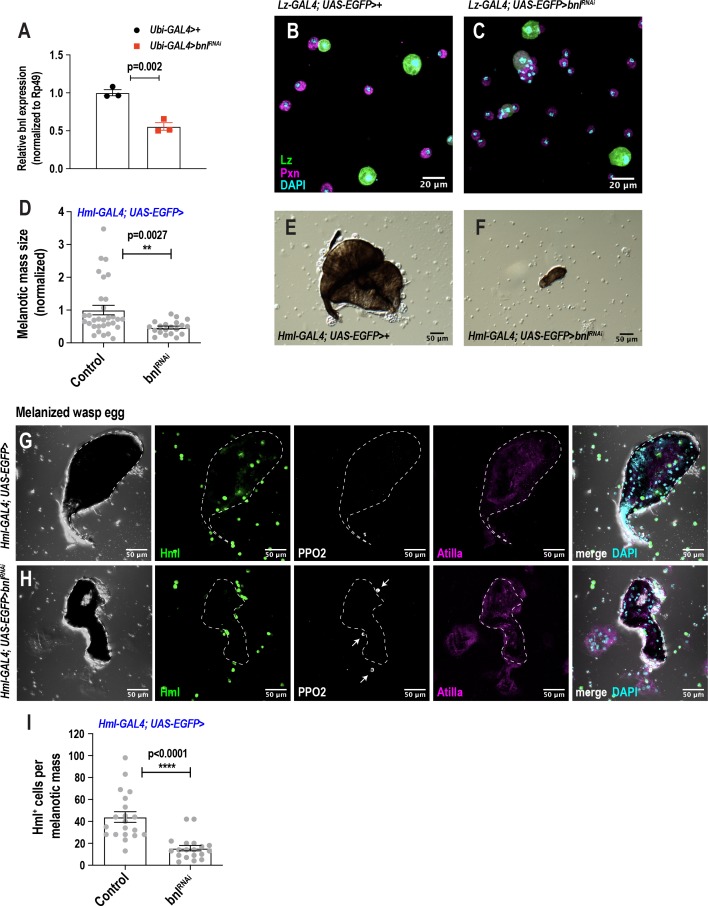
Figure 6—figure supplement 2. scRNA-seq uncovers a novel role for the FGF pathway in immune response.

Figure 6—figure supplement 2.

(A) Validation of bnlRNAi knockdown efficiency by qRT-PCR. UAS-bnlRNAi flies were crossed to Ubiquitin (Ubi)-GAL4 and the resulting RNA from Ubi >control and Ubi >bnlRNAi larvae was subjected to qRT-PCR, which determined the knockdown efficiency to be ~45%. (B-C) Representative confocal images reveal normal crystal cell morphology upon knockdown of bnl in crystal cells in normal conditions. Scale bar = 20 μm. (D-F) Knockdown of bnl in hemocytes (Hml-GAL4 >bnlRNAi) results in a significantly decreased size of the melanotic mass 48 hr post wasp infestation. Scale bar in E-F = 50 μm. (G-I) Confocal microscopy of melanized wasp eggs reveals that knockdown of bnl in plasmatocytes (Hml-GAL4 >bnlRNAi) affects the recruitment of Hml+ cells towards the melanized wasp egg. Arrows indicate intact crystal cells, labelled with PPO2, around wasp eggs in Hml-GAL4 >bnlRNAi larvae. Lamellocytes, marked by Atilla, are seen in both control and Hml-GAL4 >bnlRNAi larvae. Scale bar in G-H = 50 μm. Error bars are represented as ± SEM. Statistics were done in Prism 8 using unpaired t-test. P values are represented by * (p<0.05), ** (p<0.01), *** (p<0.001), **** (p<0.0001).
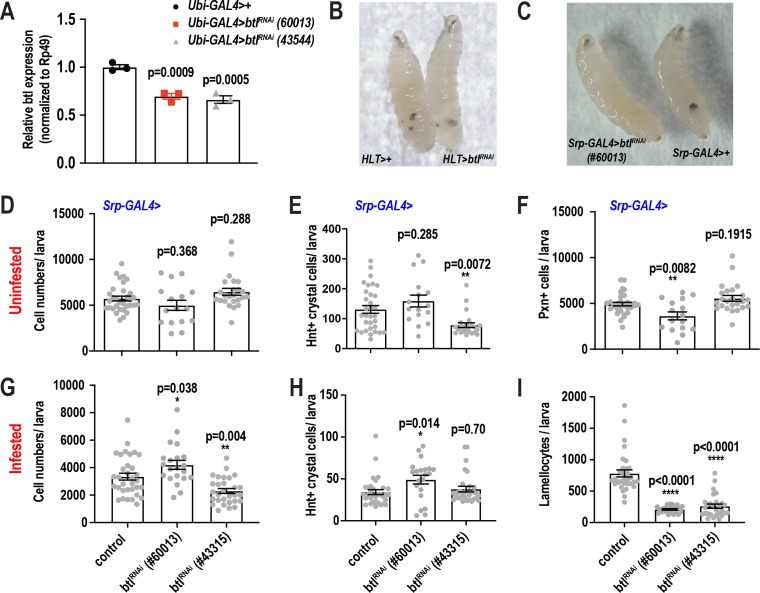
Figure 6—figure supplement 3. scRNA-seq uncovers a novel role for the FGF pathway in immune response.

Figure 6—figure supplement 3.

(A) Validation of btlRNAi knockdown efficiency by qRT-PCR. UAS-btlRNAi flies (BL#60013 and #43544) were crossed to Ubiquitin (Ubi)-GAL4 and the resulting RNA from Ubi >control and Ubi >btlRNAi larvae was subjected to qRT-PCR, which determined the knockdown efficiency to be ~30–35% in the two different RNAi lines. (B) Bright field image of wasp infested HLT-GAL4> and HLT-GAL4 >btlRNAi (#60013) larvae. (C) Bright field image of wasp infested srp-GAL4 >btlRNAi (#60013) and srp-GAL4> larvae. (D-F) Bar graphs representing average number of total cells (D), Lz+crystal cells (E), Pxn+ cells (F) per larva with or without RNAi against btl using the srp-GAL4 driver in uninfested control condition. n = 24–30 biological replicates per condition and genotype. (G-I) Bar graphs representing average number of total cells (G), Hnt+crystal cells (H), Pxn+ cells (F), and lamellocytes (I) per larva with or without RNAi against btl using the srp-GAL4 driver in 48 hr post wasp infested condition. n = 24–30 biological replicates per condition and genotype. Error bars are represented as ± SEM. Statistics were done in Prism 8 using one-way ANOVA. P values are represented by * (p<0.05), ** (p<0.01), *** (p<0.001), **** (p<0.0001).