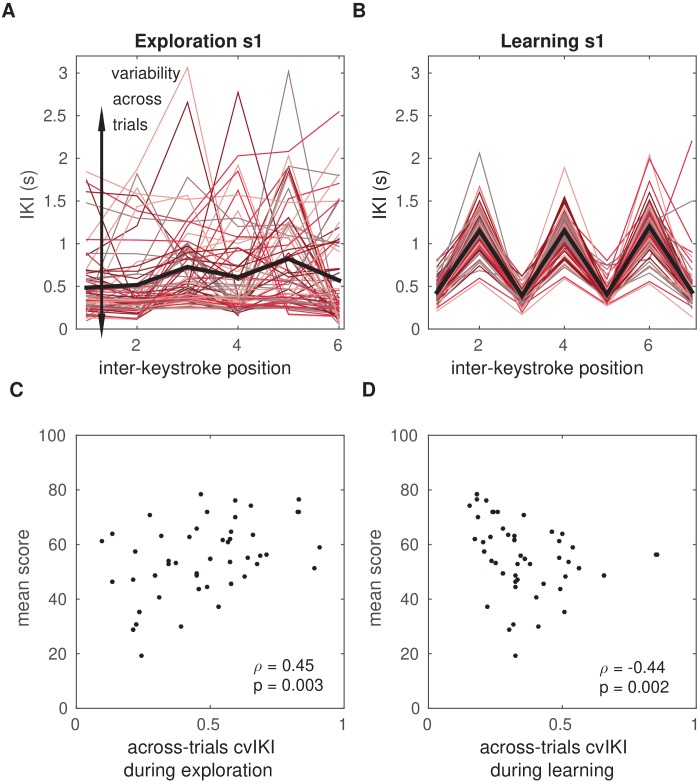
Figure 3. Temporal variability during initial exploration and during reward-based learning.
(A, B) Illustration of timing performance during initial exploration (A) and learning (B) blocks for one representative participant, s1. The x-axis represents the position of the inter-keystroke interval (sequence1: seven notes, corresponding to six inter-keystroke temporal intervals; sequence2: eight notes, corresponding to seven inter-keystroke intervals). The y-axis shows the inter-keystroke interval (IKI) in ms. Black lines represent the mean IKI pattern. Red-colored traces represent the individual timing performance in each of the 100 (A) and 200 (B) trials during exploration and learning blocks, respectively. Task-related temporal variability was measured using the across-trials coefficient of variation of IKI, cvIKI. This measure was computed in successive bins of 25 trials, which allowed us to track changes in cvIKI across time. (C) Non-parametric rank correlation in the total population (N = 60) between the across-trials cvIKI during exploration (averaged across the four 25-trial bins) and the average score achieved subsequently during learning (Spearman ). (D) Same as panel (C) but using the individual value of the across-trials cvIKI from the learning phase (cvIKI was averaged here across all eight 25-trial bins; Spearman ).

