Fig. 2.
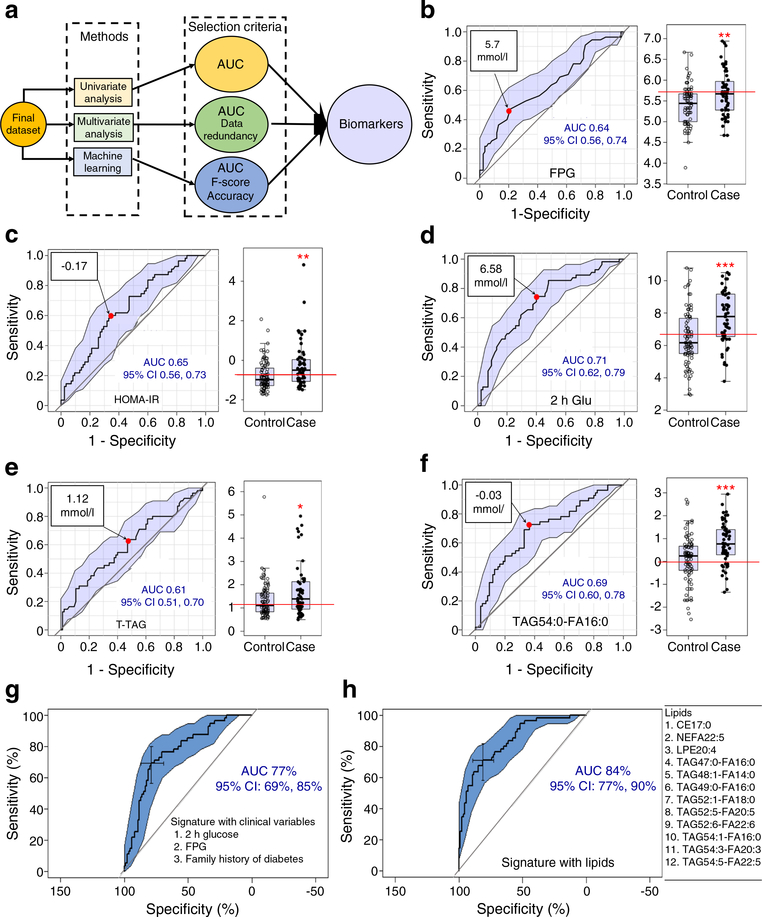
Predictive signatures/biomarkers for progression to type 2 diabetes. (a) Schematic flow diagram of the predictive signatures/biomarkers. (b) Univariate ROC analysis and box plot for FPG. The FPG value at 5.7 mmol/l (red circle) is the optimal cut-off for the mean AUC 0.64 within the 95% CI. (c) Univariate ROC analysis and box plot for HOMA-IR. The HOMA-IR value at −0.17 (red circle) is the optimal cut-off and provides the mean AUC 0.65 within the 95% CI. (d) Univariate ROC analysis and the box plot for 2 h post-load glucose in 75 g OGTT (2 h Glu). The 2 h glucose value at 6.58 mmol/l (red circle) is the optimal cut-off and provides the mean AUC 0.71 within the 95% CI. (e) Univariate ROC analysis and box plot for total fasting TAGs (T-TAG). The T-TAG value at 1.12 mmol/l (red circle) is the optimal cut-off and provides the mean AUC 0.61 within the 95% CI. (f) Univariate ROC analysis and box plot for the top AUC exhibiting lipid metabolite TAG54:0-FA16:0. The value at −0.03 mmol/l (red circle) is the optimal cut-off and provides the mean AUC 0.69 within the 95% CI. In the box plots (b–f), the distribution of population (case and control) based on FPG, HOMA-IR, 2 h glucose, T-TAG and TAG54:0-FA16:0 is shown, with the y-axis in mmol/l, except for HOMA-IR (unitless). The bottom and top of the box are the Q1 and Q3 (25th and 75th percentile), respectively, and the central band is the median (Q2 or 50th percentile). The bottom whisker is located within 1.5 IQR of the lower quartile, and the upper whisker is located within 1.5 IQR of the upper quartile. Outliers are presented in the outside of whiskers. The red line in each box plot shows the point that separates the whole population into two groups, case and control, to provide maximum class separation. A two-tailed, paired t test was carried out for each comparison; unadjusted p values: *p<0.05, **p<0.01, ***p<0.001 vs control. (g) In stepwise MLR with clinical variables, the signature with three variables (2 h glucose, FPG and family history of diabetes) provides the mean AUC 77%. (h) In stepwise MLR with lipid metabolites, the signature with 12 variables (lipids, shown on the right) provides the mean AUC 84%

