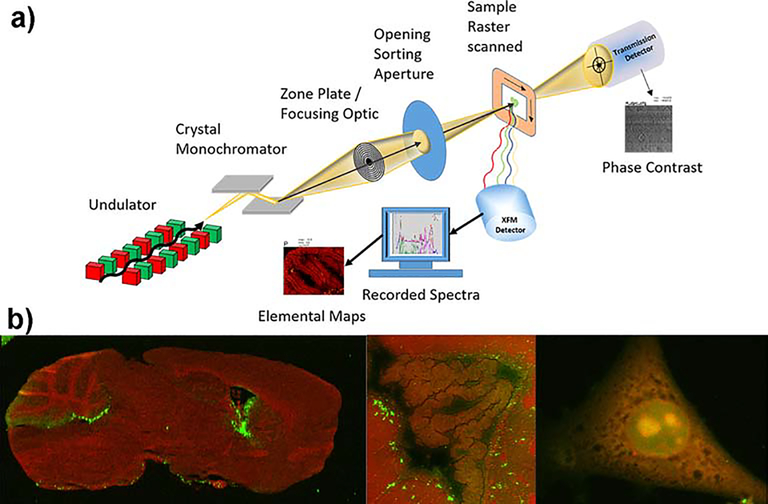
Figure 1. Principal experimental setup of XFM and representative elemental images.
a) A typical experimental setup for XFM is shown utilizing an undulator as a source for x-rays and a double crystal monochromator to tune the energy of the x-ray. A sample is scanned in x-y through the focused x-rays and fluorescence photons are collected by an energy dispersive detector. The spectra are fitted at each point and converted into area concentrations via calibration. b) Phosphorus (P, red) and Cu (green) co-localization maps of a saggital mouse brain section (left, 25 μm spot size), lateral ventricle of a coronal mouse brain section (middle, 2 μm spot size) and mouse embryonic fibroblast (right, 200 nm spot size). Elemental maps were created with the program MAPS [1]. Elemental concentration ranges are represented by false coloring from darkest (lowest concentration) to lightest (highest concentration). Mouse brain were provided by Dr. S. Hayflick (Oregon Health and Science University) and Dr. M. Knutson (University of Florida). Mouse embryonic fibroblasts were provided by Dr. M Petris (University of Missouri). Unpublished results.

