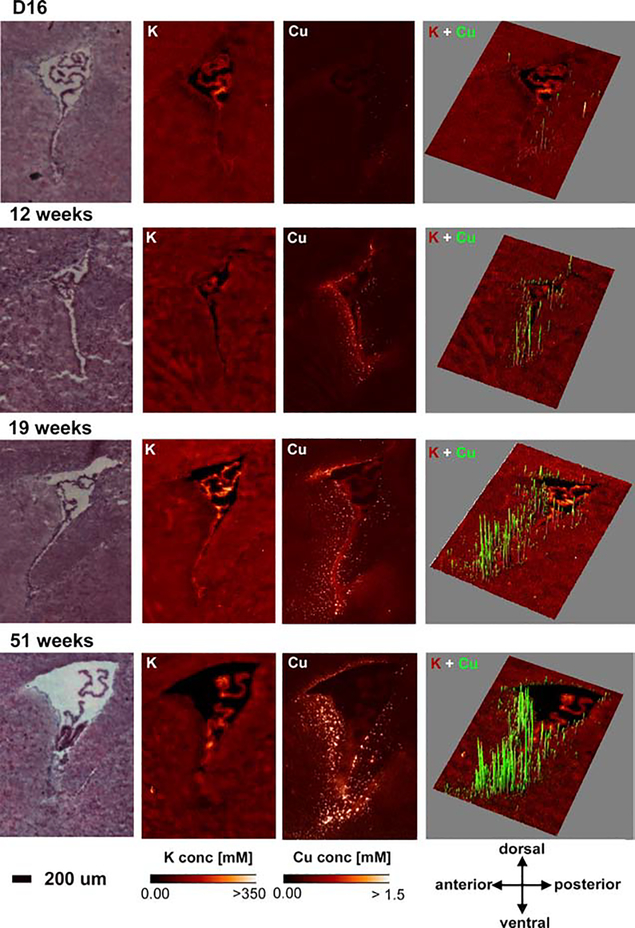
Figure 2. Age-dependent Cu accumulation into CSVs.
H&E images, elemental maps for potassium (K) and Cu, and 3D overlays for Cu (green) onto the K (red) maps are shown in brain at 16 days (D16), 12 weeks, 19 weeks and 51 weeks of age. Cu CSVs become more abundant and expand more into the brain parenchyma with age. Area concentration ranges for Cu in 3D maps were adjusted to maximize visualization (D16 0 -> 0.28 μg/cm2, 12 weeks 0->1 μg/cm2, 19 weeks 0->1.8 μg/cm2, 51 weeks 0 -> 3.5 μg/cm2). Elemental Maps were created with MAPS [1] and 3D overlays were created with the ImageJ 3D plugin [8]. Elemental concentration ranges are represented by false coloring from darkest (lowest concentration) to lightest (highest concentration). Mouse brains were provided by Dr. S. Hayflick (Oregon Health & Science University). Unpublished results.

