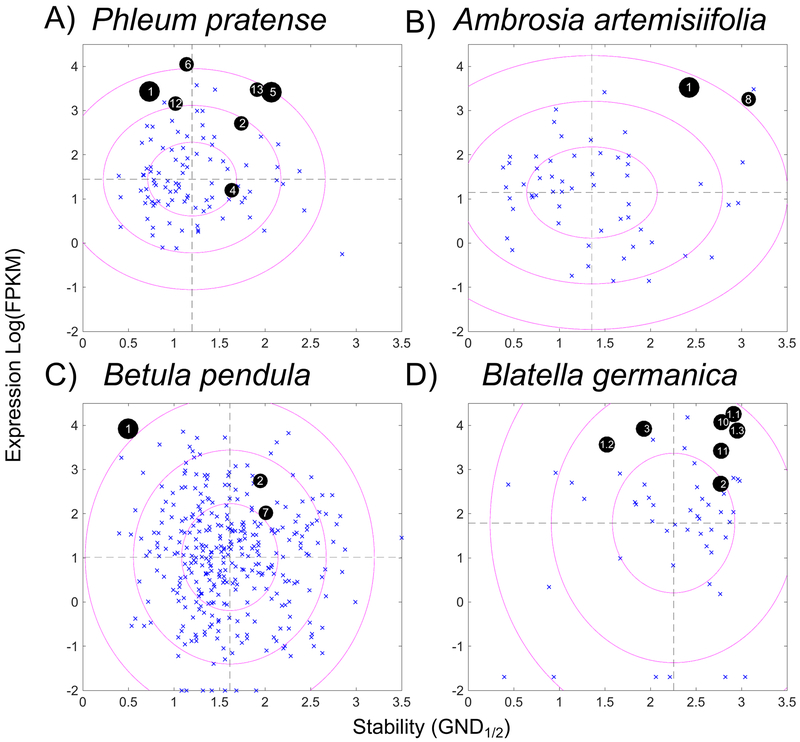
Figure 1.
Scatter plots of allergens versus non-allergens correlating transcript levels and stability. GND1/2 is the measure of stability and is the concentration of guanidinium chloride at the transition midpoint of the chemical denaturation curve. FPKM (fragments per kilobase per million reads) is the relative transcription level plotted on a log scale. A-D, blue x’s mark non-allergens from the labeled source and black circles represent allergens. The allergen number is annotated and major allergens are larger circles. The source of proteins in A, B, and C is pollen extract of Phleum pretense, Ambrosia artemisiifolia, and Betula pendula, respectively. In D, the source was an extract of frass from Blatella germanica. Dashed lines are mean values for non-allergens, and ellipses are plotted with radii at 1, 2, and 3 times the standard deviation for transcript levels and stability.

