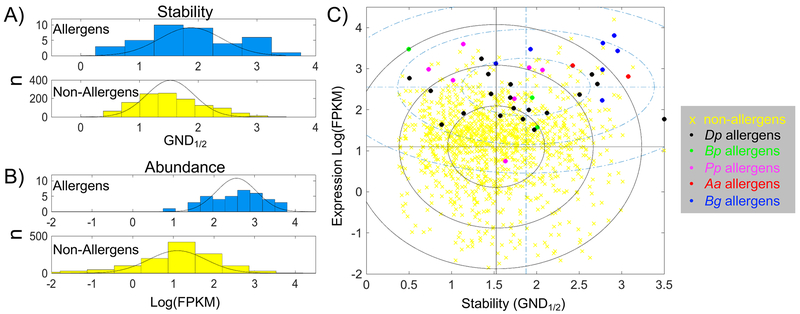
Figure 2.
Pooled allergen data for stability and expression. Histograms for stability (A) and transcription (B) data for of allergens versus non-allergens. Black lines superimpose a fitted gaussian distribution. C) Scatter plot from pooled allergen data. Blue dash-dot lines are mean values for allergens, black lines for non-allergens. Ellipses are plotted with radii at 1, 2, and 3 times the standard deviation for transcription and stability, blue dash-dot for allergens, black solid lines for non-allergens. Yellow x, pooled non-allergens, circles are allergens colored according to the legend. GND1/2 and FPKM are described the legend of Figure 1.

