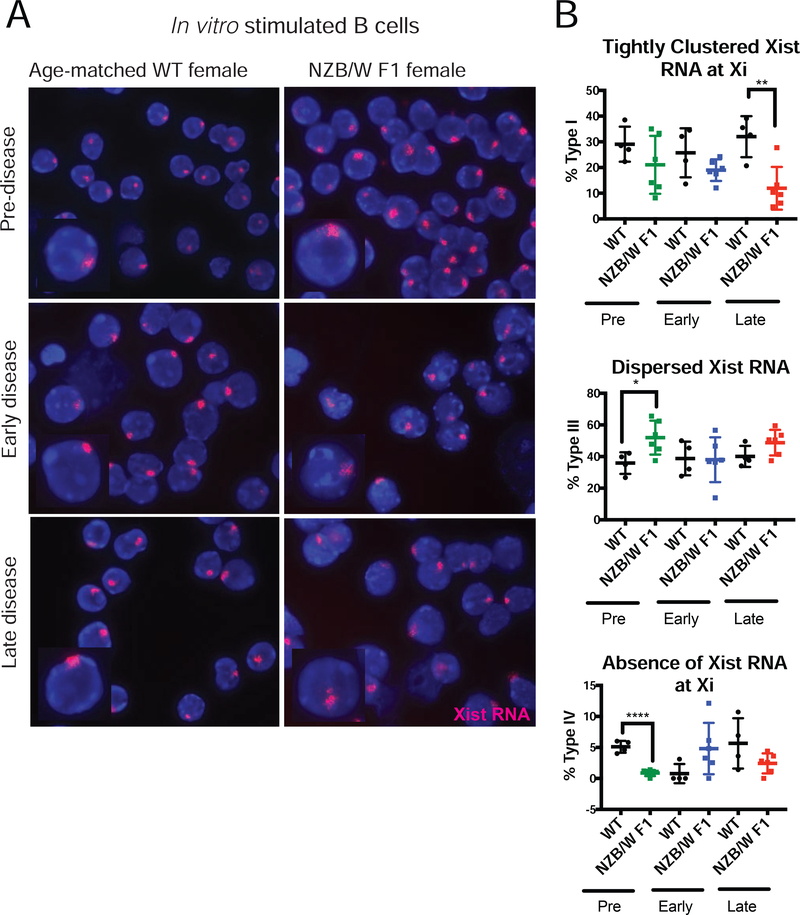
FIGURE 2. Late-stage disease NZB/W F1 stimulated B cells lose Xist RNA localization at the Xi.
(A) Xist RNA FISH images for nuclei from CD23+ B cells stimulated in vitro for 24 hours with CpG, from WT-age matched controls (n = 4) and NZB/W F1 (n = 6) females, for each of the three disease categories (Supplementary Figure 1). Xist RNA is red, DAPI nuclear counterstain in blue. Representative cells collected from multiple independent experiments are shown. (B) Quantification of Xist RNA localization patterns in NZB/W F1 and wildtype stimulated B cells for the three disease categories. The percentage of cells with Xist RNA tightly clustered at the Xi (top), Xist RNA dispersed throughout the nuclei (middle), and with no detectable Xist RNA signals (bottom) are shown. The mean across replicates and standard deviation of the mean is shown. Significance was determined by unpaired t test. *p<0.05, **p<0.01, ****p<0.0001. Total nuclei counts for each animal are shown in Supplemental Figure 3.

