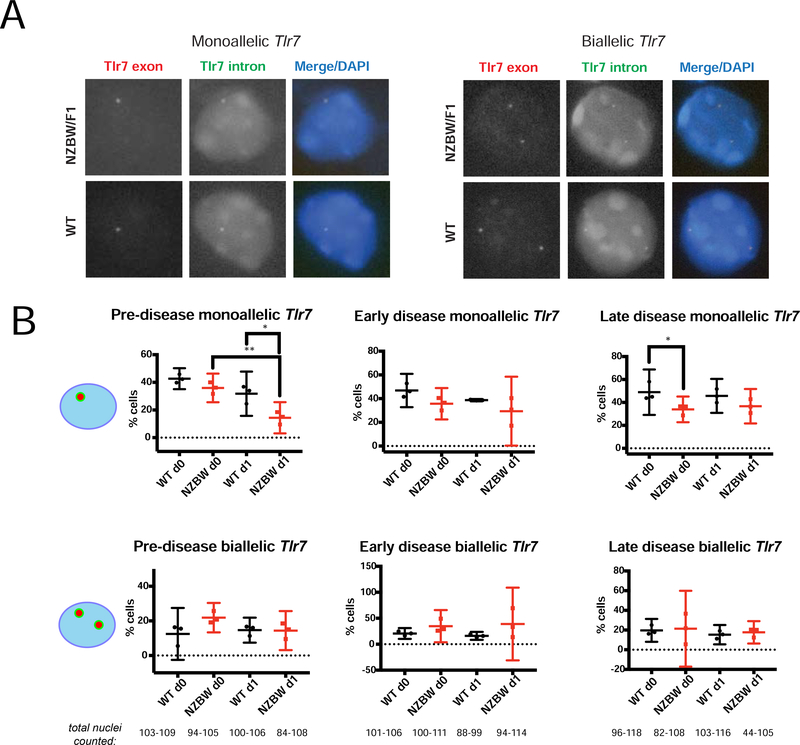
FIGURE 5. Percentages of biallelic-expressing Tlr7 B cells in NZB/W F1 mice do not change with disease.
(A) Single molecule RNA FISH for Tlr7 using probes specific for exonic regions (Cy3, red) and intronic regions (FITC, green). Representative nuclei showing examples of mono-allelic (left) and biallelic Tlr7 expression from NZB/W F1 or wildtype (C57Bl/6 or BALB/c) age-matched female B cells. (B) Quantification of monoallelic (top) and biallelic (bottom) smFISH signals in single nuclei from WT age-matched (n = 3) and NZB/W F1 (n = 3) female B cells (naïve and 24-hour CpG-stimulated), for the three disease categories. Only co-localization of red (exon) and green (intron) pinpoints were counted. The total number nuclei counted for wildtype and NZB/W F1 samples is shown below the bottom row of graphs. The mean across replicates and standard deviation of the mean is shown; significance was determined by unpaired t test. *p<0.05, **p<0.01.

