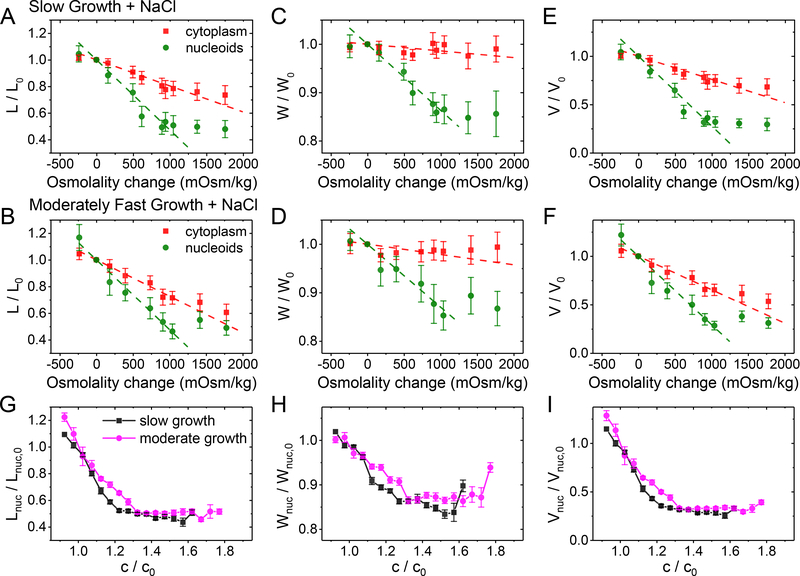
Figure 2. Change in nucleoid dimensions as a function of external osmolality and as a function of crowder concentration.
(A, B) Relative change of nucleoid (green circles) and cytosolic (red squares) lengths at different osmotic shock in slow and moderately fast growth conditions, respectively. Each osmolality value corresponds to a separate measurement. Error bars are std. Dashed lines are linear fits to the experimental data in the range from −0.25 to 1.25 Osm kg−1. The best fit parameters can be found in SI Table S4. The same for nucleoid and cell widths (C, D) and calculated volumes (E, F) in these two growth conditions. (G) Nucleoid length, (H) width, and (I) calculated volume in slow (black squares) and moderately fast (magenta circles) growth conditions as a function crowder concentration. The crowder concentrations (c) are relative to those in normal growth medium without excess NaCl (co). The details of calculating these concentrations can be found from SI Text: Determination of crowder concentration based on the intensity of fluorescent reporters. Error bars represent s.e.m.

