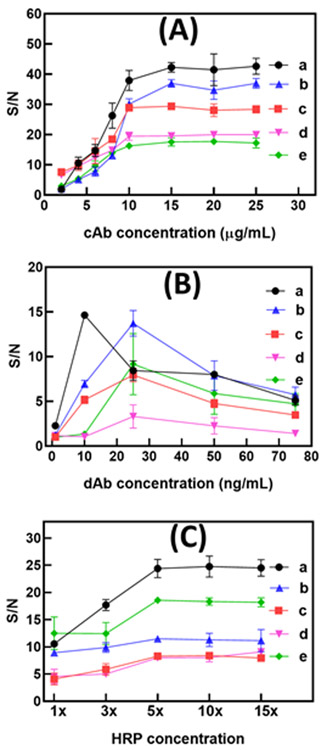
Fig. 3.
Graphs for determination of optimal cAb, dAb and HRP concentrations. The error bars are standard deviations. Types of cytokine; (a) IL-6, (b) TNF-α, (c) IL-10, (d) IL-1β and (e) CCL18; (A) cAb concentration (0-25 μg mL−1), (B) dAb concentration (0–75 ng mL−1) and (C) HRP concentration (1×−15×).

