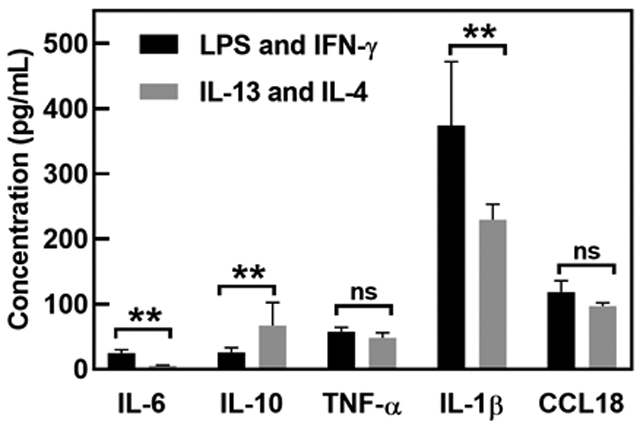
Fig. 5.

Measurement of cytokine production by differentially-treated macrophage (LPS, IFN-γ and IL-13, IL-4), n = 3 replicate measurements, error bars are SDs. “ns” indicates not significant (p>0.05), whereas ** indicates significant difference (p<0.01) (unpaired t-test).
