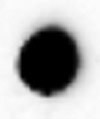
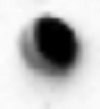
Table 2.
Effect of incubation time on ATPS ELISA (15 minutes, 1 hour and 4 hours). The performance was carried out with information, LOD, CV (%) and S/N±SD (n=3) obtaining by using each incubation time as listed below.
| Incubation time |
LOD (pg mL−1) | CV (%) | S/N±SD | ELISA image | |
|---|---|---|---|---|---|
| Signal | Noise | ||||
| 15 minutes | 180 | 9.1% | 3.70±0.03 |  |
|
| 1 hour | ~1 | 1.4% | 30.0±1.0 |  |
 |
| 4 hours | 340 | 7.8% | 1.6±0.1 |  |
 |
