
Table 3.
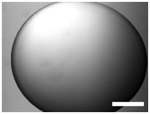
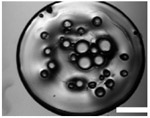
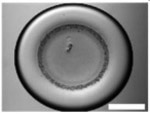
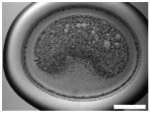
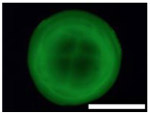
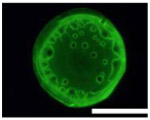
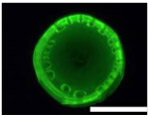
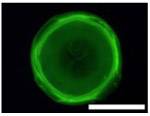
Images of dried spots employing different type of blocking buffer with 5% DEX containing IgG FITC-antibodies. A scale bar was 1000 μm. Performing of ATPS ELISA was carried out with information, LOD, CV (%) and S/N±SD (n=3) obtaining by using each blocking buffer as listed below.
| Parameter | 3× StabilCoat | 1× StabilCoat | 5%BSA | 5%Goat serum |
0.1%Chonblock/ 0.05%goat serum |
|---|---|---|---|---|---|
| Bright field images | 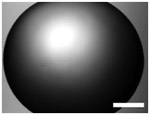 |
 |
 |
 |
 |
| Fluorescence images | 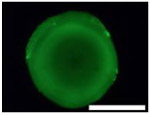 |
 |
 |
 |
 |
| Chemilumine-scence value of the background ±SD (AU) | 200,000±5,000 | 300,000±8,000 | 200,000±100,000 | 400,000±60,000 | 2,000,000±200,000 |
| LOD (pg mL−1) | ~1 | 20 | 100 | 60 | 100 |
| CV (%) | 2 | 3 | 30 | 10 | 10 |
| S/N±SD | 28.0±0.6 | 26.0±0.5 | 30.0±15.0 | 10.0±3.0 | 3.7±0.3 |