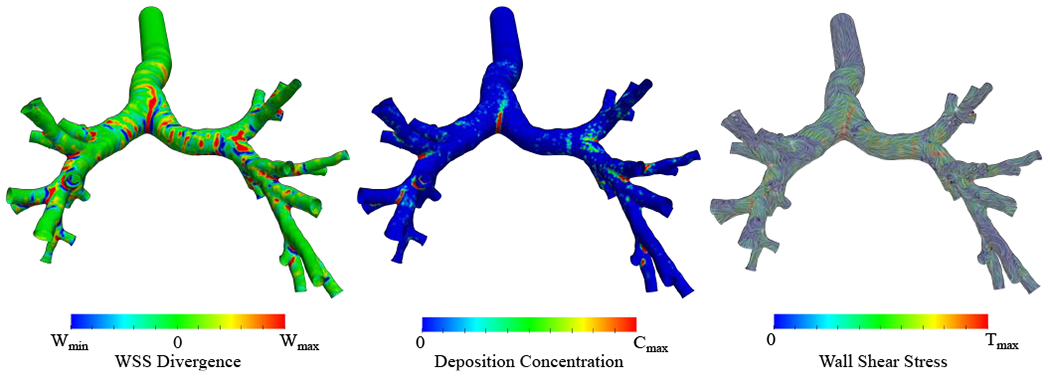
Figure 3:

Case-control WSS divergence (WSSdiv), deposition concentration (DC), and WSS streamlines are shown. The colors represent the magnitude of each parameter. The DC result corresponds to 5 μm particle. Wmin = −8, , Cmax = 20, and . All of the ranges are scaled for better visualization and do not reflect data range.
