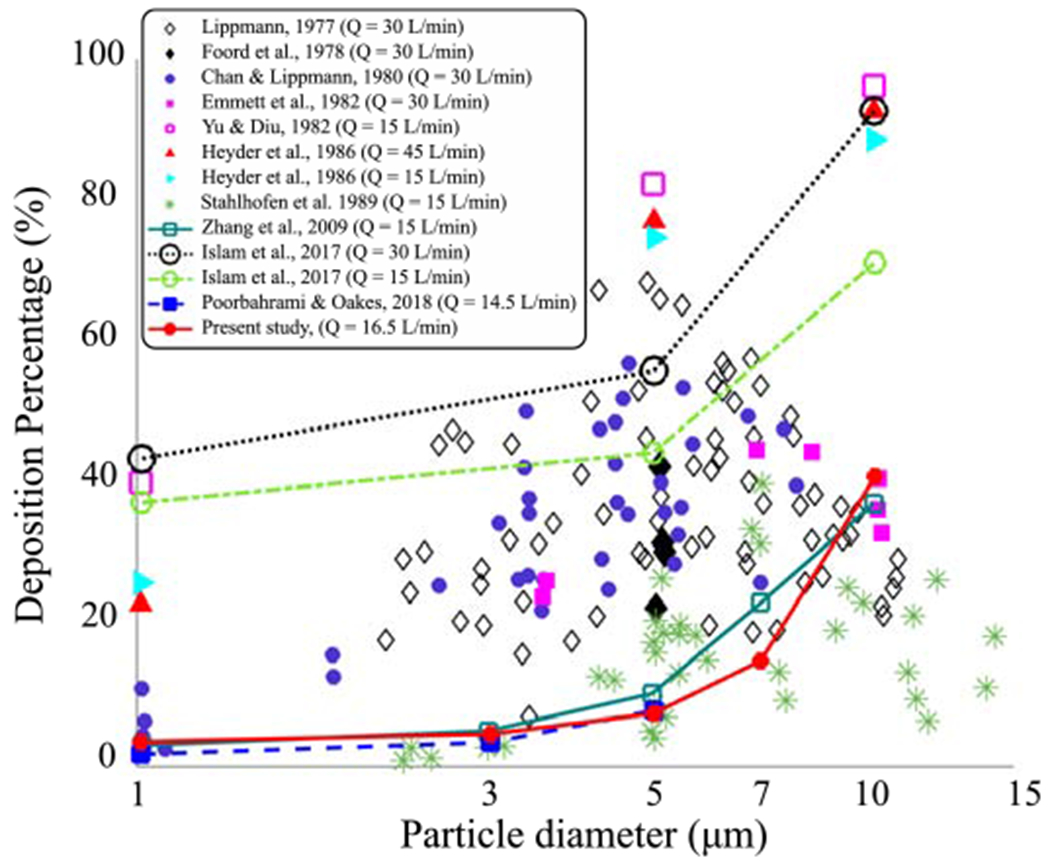
Figure 4:

Inspiratory deposition percentage (DP) is shown in terms of particle diameter in the TB airway. Five particle diameters (dp = 1, 3, 5, 7, 10 μm) in the case-control model are compared to experimental measurements [10, 19, 23, 28, 42, 64, 79] and numerical simulations [82, 30, 57]. All scatter plots represent experimental data and the lines represent numerical simulations. The Mean flow rates used in each study are reported. The number of generations are 16, 17, 9, and 9 for Zhang et al. [82], Islam et al. [30], Poorbahrami and Oakes [57], and our simulation, respectively.
