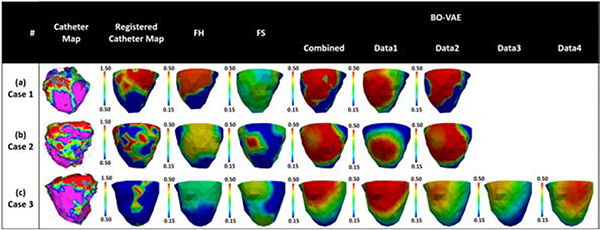
Figure 15:
Evaluation of the estimated tissue excitability in real data studies in comparison to in-vivo voltage maps on three patients. First, we compared the results obtained with BO-VAE (column: Data1) with those obtained with FH and FS methods. Second, we compared the results obtained with BO-VAE using individual ECG data vs. with the result obtained when using all ECG data at once (column: combined).

