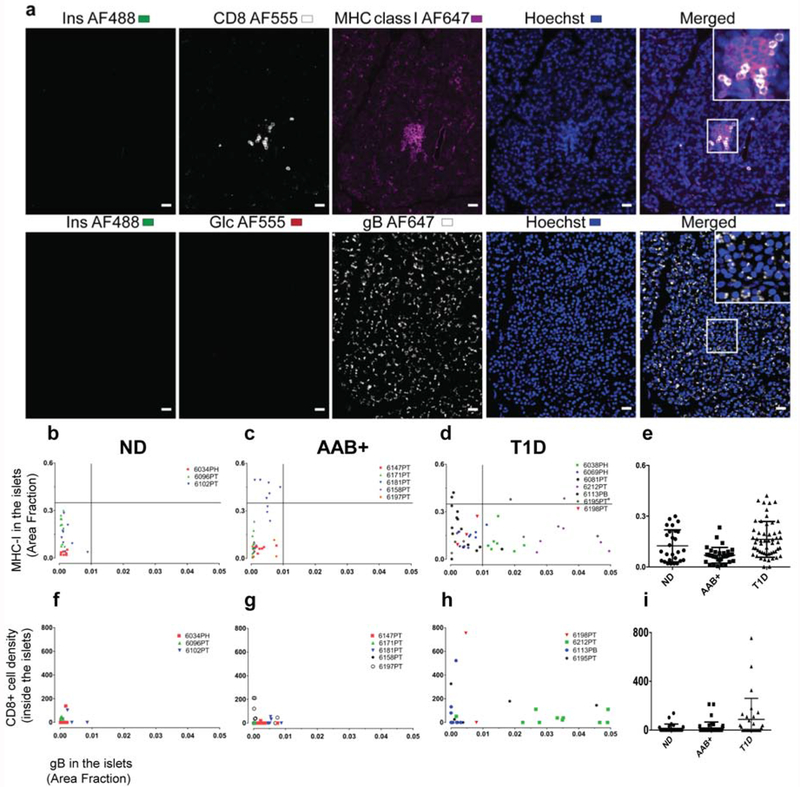
Figure 3. Islet MHC class I expression and CD8 T cells infiltration is not associated with gB expression.
Representative images from case 6195 (T1D) positive for CD8, MHC class I, and gB staining (a). Top panel: section stained with insulin (green), CD8 (white), MHC class I (magenta), and Hoechst (blue). Bottom panel: the consecutive section was stained with insulin (green), glucagon (red), gB (white), and Hoechst (blue). Last column in each panel (right) shows the merged channels and inserts show magnification of the area inside the box.
Correlation between gB protein level and MHC class I expression inside the islets is presented based on the area fraction in (b) non-diabetic donors (n=3), (c) AAB+ donors (n=5), (d) donors with T1D (n=7) and (e) in groups. For each case up to 10 islets were quantified. Each dot represents an islet and each color represents an individual donor. Correlation between gB protein level and CD8 T cells density inside the islets in each group are presented (f-i). Each dot represents an islet and each color represents an individual donor. CD8 counting inside the islets was manually performed from scanned images and the CD8 density was presented as total CD8 number divided by the islet size. For ease of presentation, this value was multiplied by 10x6.

