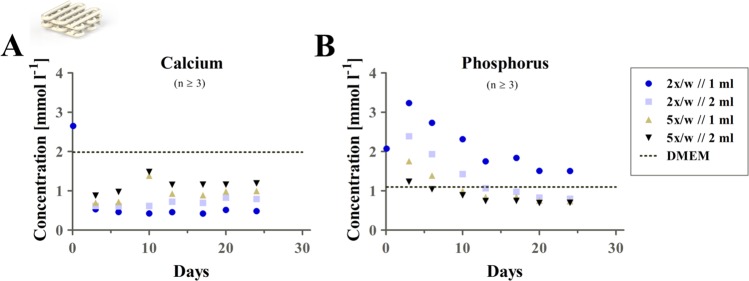
Figure 11.
Calcium and phosphate (phosphorus) concentrations. Tracking of the concentrations of calcium (A) and phosphorus (B) during cultivation of a pure CPC scaffold over 24 days for different medium change regimes. An initially elevated phosphorus concentration was revealed, while calcium concentration was decreased by comparing different cultivation and medium change schemes to the concentration calculated for plain DMEM. First observed sample was measured after 2 h of incubation. The dashed line represents measured concentration in CPC-free, non-incubated cell culture medium, mean ± SEM, n ≥ 3, w = week.

