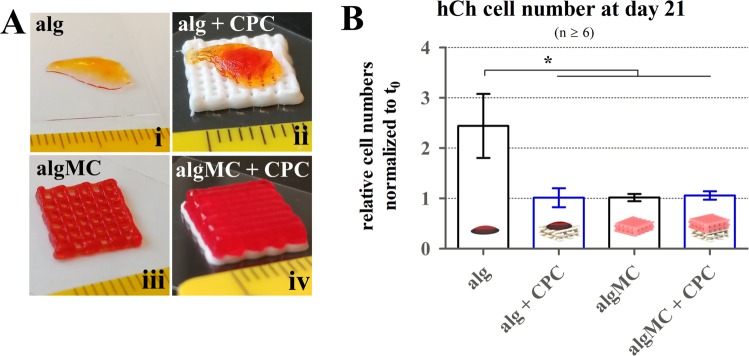
Figure 8.
Cell numbers of 3D plotted hCh in algMC in the presence of CPC in a zonal (piled) orientation. (A) For co-cultivation of hCh-laden structures in contact to the CPC phase, alg disks (i, ii) and algMC scaffolds (iii, iv) (both visualized via addition of phenol red) were placed on top of plotted CPC scaffolds (ii, iv), scale in mm. (B) Relative cell numbers after 21 days of differentiation normalized to day 0 for alg disks and 3D plotted algMC scaffolds with and without contact to CPC (n ≥ 6). mean ± SEM, *p < 0.05.

