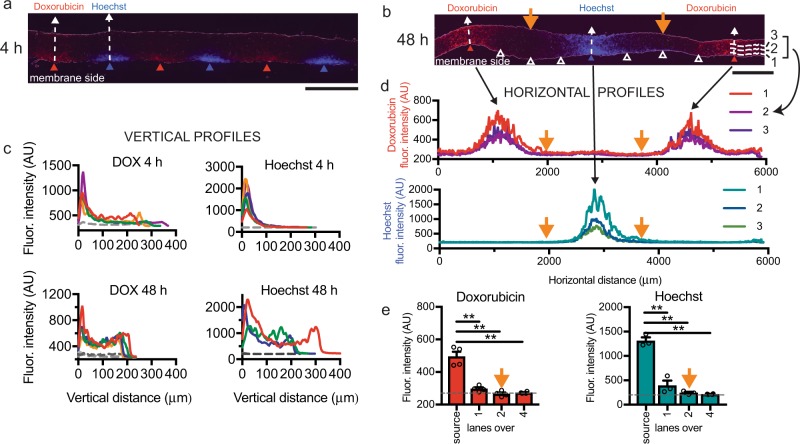
Fig. 2. Fluorescent analysis for microfluidic drug delivery to tissue.
Vertical concentration gradients of fluorescent doxorubicin (DOX, red) and Hoechst dye (blue) in U87 xenograft slices at 4 h a or 48 h b, separated by buffer lanes (white triangles). c Vertical fluorescence profiles above source lanes versus distance from the membrane at 4 h or 48 h. Colored lines represent average fluorescence at different lanes for 4 h (4 DOX, five Hoechst), and at spaced locations on 2 lanes for 48 h (4 DOX, three Hoechst). Gray profiles represent Hoechst for doxorubicin (and vice versa), averaged at 4 h and individual profiles at 48 h. d Horizontal profiles at 48 h show lateral diffusion. Locations indicated in b (lines 1–3). e Lateral fluorescence spread from source lanes at 48 h as indicated in d. Average ± SEM, n = 4 for DOX, n = 3 for Hoechst except for four lanes over. One-way ANOVA, Tukey’s multiple comparison test. **p < 0.0001. Scale bars: 500 μm a, b.

