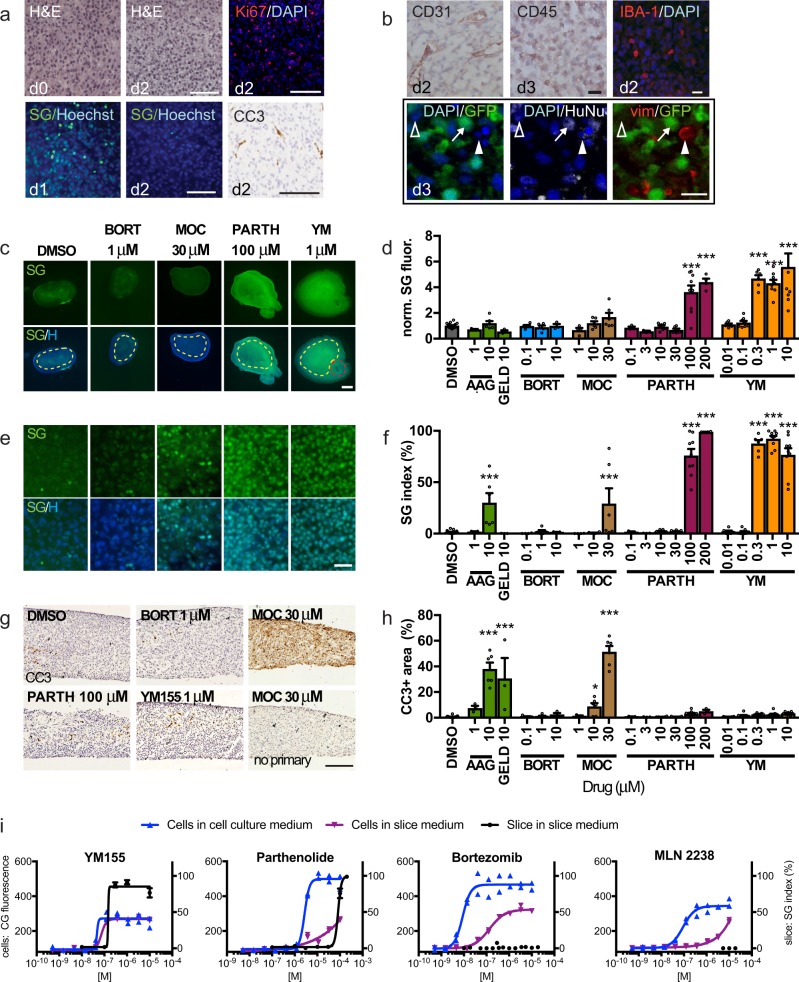
Fig. 3. U87 glioma xenograft slice culture characterization and drug responses.
a Retention of tissue integrity in U87 flank xenograft slice cultures by H&E staining, cell proliferation detected by Ki-67 immunostaining (red, DAPI counterstain) and cell death by SYTOX Green (SG)/Hoechst (blue) staining or by cleaved caspase 3 (CC3)/hematoxylin staining. b Xenograft slices contain endothelial (CD31), immune (CD45) and macrophage (IBA-1) cells. Confocal images identify U87 glioma cells (arrow, GFP+/HuNu+), vimentin-positive mesenchymal stromal cells (vim, red, solid arrowhead) and additional non-tumor cells (open arrowhead). c–f Slices treated for 2 or 3d and assessed for cell death by SG/Hoechst staining. Tanespimycin (AAG), geldanamycin, bortezomide (BORT, 3 d), mocetinostat (MOC, 3 d), parthenolide, and YM155 (YM). Cell death was quantified by mean fluorescence (dotted regions) c, d or by % SG+/total nuclei e, f. Red outline in c is a positive control crush lesion. g, h Apoptotic cell death quantified as CC3-stained area. No primary antibody control is shown. i Cell death in U87 cells by loss of CellTox Green fluorescence28 when grown in conventional (blue) or slice (purple) medium, versus U87 xenograft slices (black line) in slice medium (SG index). For d, f, h, average ± SEM; n = 17, 3, 6, 5, 5, 3, 3, 4, 6, 6, 3, 3, 7, 6, 9, 4, 6, 8, 6, 9, 9 slices for each drug condition, in order. One-way ANOVA versus DMSO with Dunnett’s multiple comparison test. *p < 0.05, **p < 0.001. Cell line assays were done in duplicate. Scale bars: 100 μm a, g, 20 μm b, e, 1 mm c.

