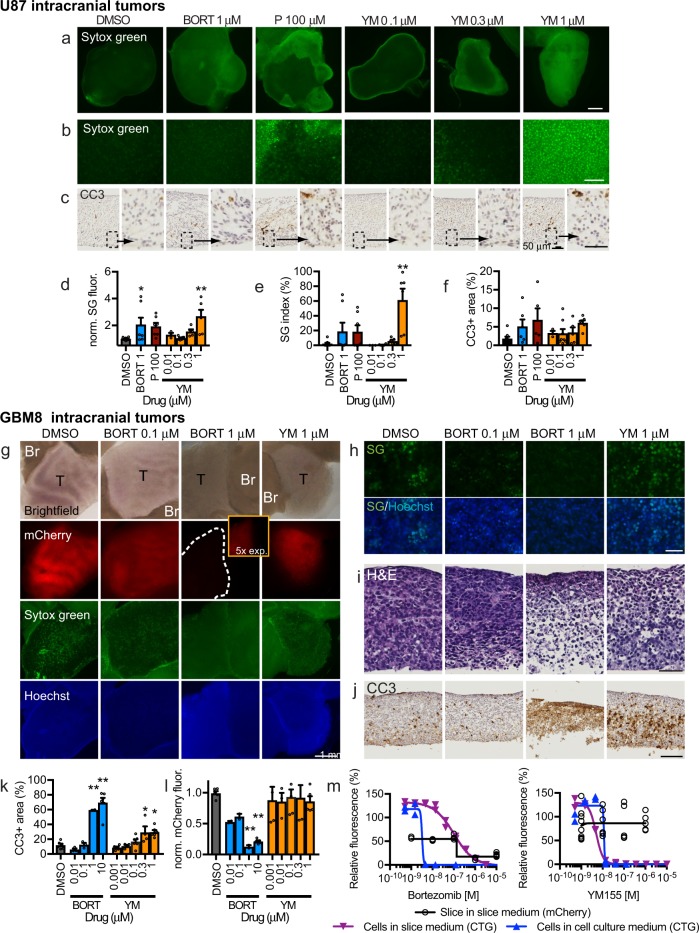
Fig. 4. Intracranial xenograft drug response in slice culture.
a, f Cell death detected in U87 intracranial xenograft slices after 2 or 3 d treatment by SYTOX Green (SG) a, b or cleaved caspase 3 (CC3) staining c. Drugs used were bortezomide (BORT, 3 d), parthenolide (P, 2 d), YM155 (YM 2d) and DMSO vehicle control (0.1%, 2 and 3 d). Cell death was quantified by SG fluorescence d, e or by CC3 staining f. g–h GBM8 glioma stem cell intracranial xenograft drug response in slice culture. g mCherry-labeled GBM8 tumor (T) and adjacent brain (Br), with cell death changes detected by loss of mCherry, as well as by changes in SG/Hoechst g, h H&E i, and CC3 j staining. Bortezomide reduced GBM8-mCherry signal k, whereas both drugs increased % CC3-stained area l. Dose–response curves for GBM8-mCherry xenograft slices versus the original GBM8 cells grown in glioma cell culture (blue line) or slice culture (purple line) medium. Cell death was assessed by CellTiter-Glo for GBM8 cells, and by loss of mCherry fluorescence for slices. Average ± SEM with n = 8, 7, 7, 3, 8, 5, 6 slices per drug condition d–f except for n = 6 (BORT 1) and n = 5 (P 100) f; n = 6, 3, 3, 3, 3, 6, 5, 4, 6, 5, 6 slices per drug condition k, l, and duplicates for cell lines m. One-way ANOVA versus DMSO with Dunnett’s multiple comparison test. *p < 0.05, **p < 0.001. Scale bars: 1 mm a, g, 100 μm b, j, 25 μm c, 50 μm h, i.

