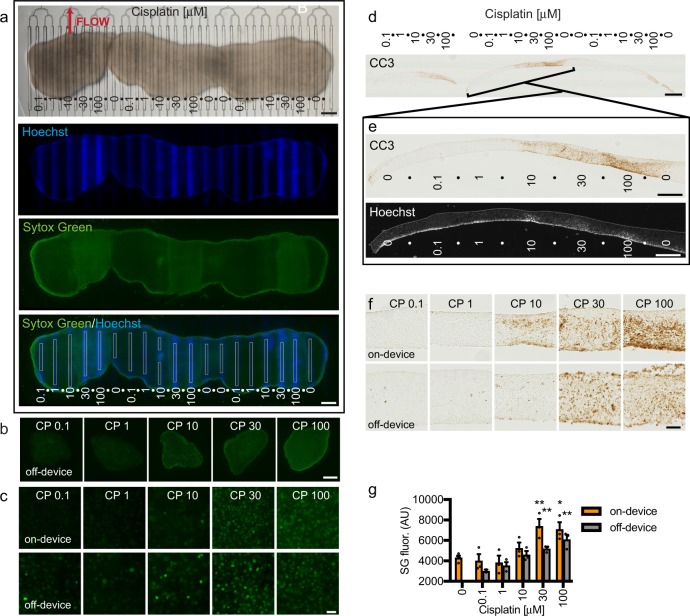
Fig. 5. Xenograft slice culture dose-dependent drug response on and off the device.
a Three U87 flank glioma slices on a microfluidic device were treated with different doses of cisplatin (doses in μm) from days 1 to 3, followed by Hoechst dye in the drug lanes, then SYTOX Green (SG) staining of the entire undersurface. Drug lanes were separated by buffer lanes. SG mean fluorescence intensity (boxed lane regions, 100 μm wide) was used to quantify cell death (bottom panel). b Low power images of SG staining from xenograft slices treated with drugs off-device in parallel. c High power images of SG staining of slices treated on-device or off-device. d, e Apoptotic cell death in cross-sections was detected by cleaved caspase 3 (CC3) staining. Lane locations were identified by alignment with Hoechst fluorescence. f Higher resolution images of CC3 staining on-device or off-device. g Cell death in response to CP on or off-device, measured by SG mean fluorescence. Average ± SEM with n = 3 (lanes/slices) except for n = 4 for 0 and n = 2 for 0.1 μm CP tested off-device. One-way ANOVA versus 0.1 μm with Dunnett’s multiple comparison test separately for on and off-device. *p < 0.05. **p < 0.01. Scale bars: 1 mm a, b, d, 100 μm c, f, 500 μm e.

