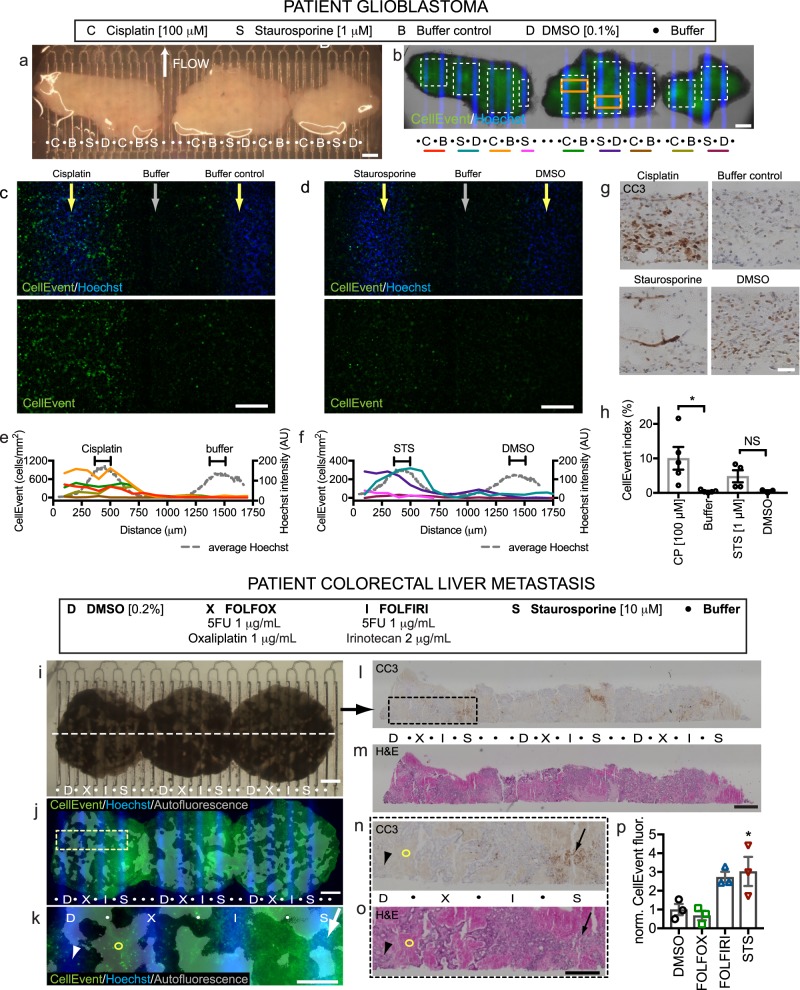
Fig. 7. Patient glioblastoma and colorectal tumor drug responses on the device.
a–h Human glioblastoma resection slices treated for 24 h on-device with cisplatin (C), staurosporine (S, STS), DMSO (D, control for STS) or buffer (B) starting at d1. b CellEvent staining for apoptosis, shown at higher power for orange boxes in c, d. e, f CellEvent+ density (cells/mm2, bins) across lane pairs (same-color underlines and white boxes in b). Hoechst signal (gray lines) indicates drug delivery lanes. g Cleaved-caspase 3 (CC3) staining detects apoptosis in sections. h CellEvent+ cell fractions over drug lanes (100 μm wide). Average ± SEM, individual points overlaid, n = 5, 5, 4, 3. Student’s t test for CP v Buffer and STS v DMSO, *p ≤ 0.05. i–n Colorectal cancer liver metastasis slices treated for 2 days on-device with FOLFOX (X), FOLFIRI (I), DMSO (D), or staurosporine (S). Hoechst identifies drug lanes. j, l CellEvent shows apoptosis increased over drug lanes (arrow) versus DMSO (arrowhead). Red autofluorescence reveals old necrosis (circle). l–p Sections stained for CC3 l or H&E m, boxed at higher magnification in n, o, show CC3 staining after staurosporine (red arrow) but not DMSO (arrowhead) treatment. p Apoptosis quantified by CellEvent fluorescence normalized to DMSO (200 μm wide). Average ± SEM, n = 3. One-way ANOVA versus DMSO control, Dunnett’s multiple comparison test. *p < 0.05. Scale bars: 1 mm a, b, i, j, l, m, 200 μm c, d, 500 μm e, 50 μm g, 500 μm k, n, o.

