Figure 5.
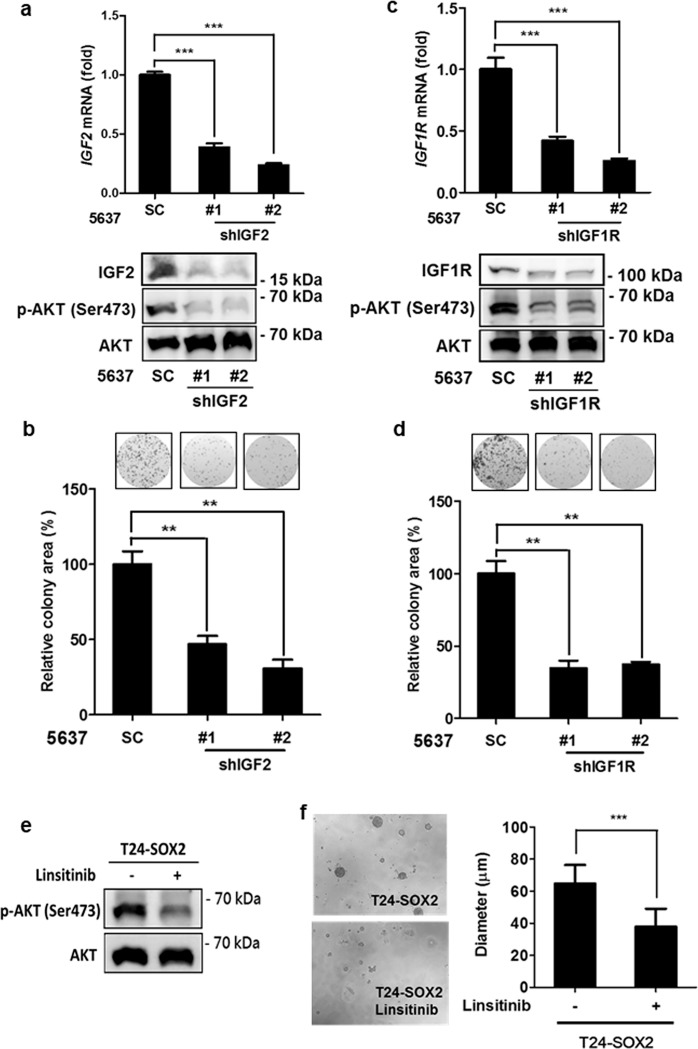
SOX2-induced IGF2/IGF1R signaling is essential for bladder cancer cells. (a) qPCR (upper) and immunoblotting (lower) analysis of 5637 cells transduced with the lentiviral vector encoding shRNA against IGF2 (shIGF2) or scrambled control vector (SC). The #1 and #2 indicate the two distinct shRNAs that target different regions within IGF2. ***P < 0.001. (b) Clonogenic assay of 5637 cells transduced with shIGF2 or scrambled control vector (SC). Colonies were subjected to crystal violet staining (top) and quantified by ImageJ analysis. Results are the average of three replicates and expressed as the mean ± S.D. **P < 0.01. (c) qPCR (upper) and immunoblotting (lower) analysis of 5637 cells transduced with the lentiviral vector encoding shRNA against IGF1R (shIGF1R) or scrambled control vector (SC). The #1 and #2 indicate the two distinct shRNAs that target different regions within IGF1R. ***P < 0.001. (d) Clonogenic assay of 5637 cells transduced with shIGF1R or scrambled control vector (SC). Colonies were subjected to crystal violet staining (top) and quantified by ImageJ analysis. Results are the average of three replicates and expressed as the mean ± S.D. **P < 0.01. (e) Immunoblotting analysis to assess the expression of phosphorylated AKT at Ser473 and total AKT expression in SOX2-expressing T24 cells under low-serum (1% FBS) condition in the presence or absence of linsitinib (5 μM) for 48 hr. (f) 3D colony-forming analysis to assess linsitinib effect on colony formation of SOX2-expressing T24. The cells were grown under the low-attached condition in low-serum medium (1% FBS) in the presence or absence of linsitinib (5 μM) for 7 days. Photos (left) are representative images of the colony and colony sizes were quantified (right). Results are the average of three independent experiments and expressed as the mean ± SD. ***P < 0.001.

