Figure 4.
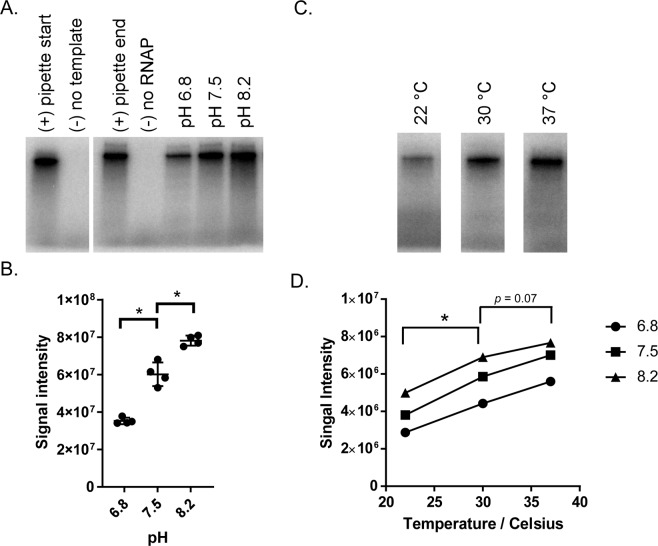
pH and temperature ranges for RNA polymerase activity. (A) RNA products from in vitro transcription reactions conducted at 30 °C and pH 6.8, 7.5, or 8.2 were separated on 10% TBE-urea gel. Radiolabeled RNA was detected by phosphor imaging. Reactions were initiated individually, and controls were added for transcription initiation timing (pipette start and end). (B) Signal intensity on the phosphor screen was determined by densitometry using data collected from four replicate experiments. Asterisks indicate p-value of <0.001 in a comparison of signal intensity between pH values using a one-way ANOVA. (C) Representative image of RNA products generated from in vitro transcription reactions carried out at 22, 30, or 37 °C, at pH 6.8 and separated on 10% TBE-urea gel. Cropped gels were generated from a single image. (D) pH and temperature conditions yielding the highest RNA polymerase activity. Signal intensities from phosphor imaging were determined by densitometry. Each point represents the average of two replicate experiments. Asterisks indicate p-value of <0.001 in a comparison of signal intensity achieved at different temperatures in a mixed-effects ANOVA to account for pH-based differences.

