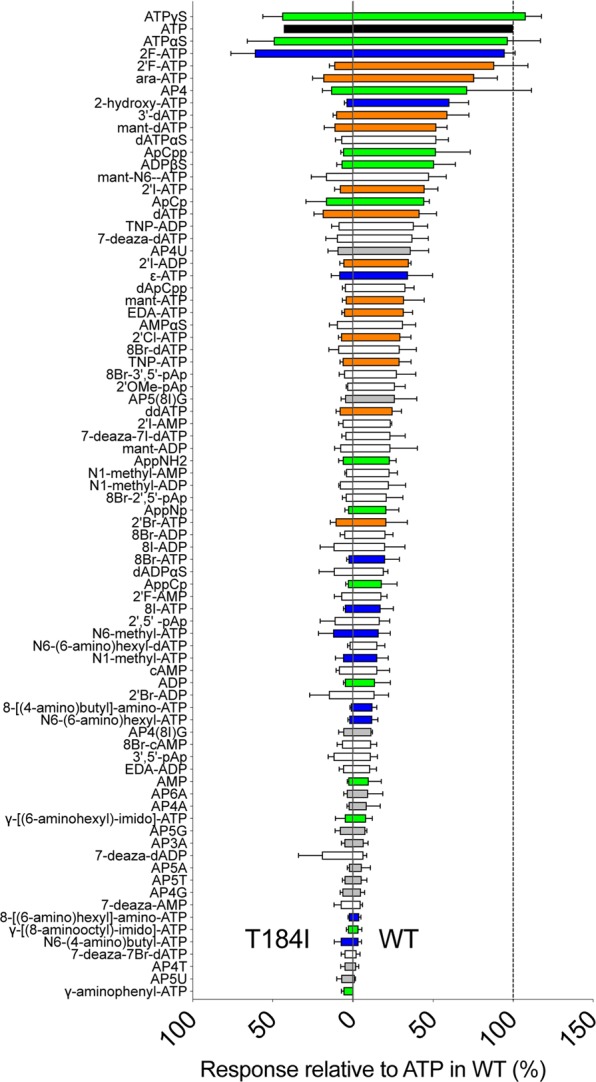
Figure 5.

Comparative response to 80 adenosine nucleotides tested at 100 μM at wild-type and T184I rat P2X2 (mean and SEM, N = 3–6) expressed in Drosophila taste neurons. Wild type (WT) rat P2X2 (data from Fig. 2) at right and T184I mutant at left. Nucleotides are arranged in order of activity relative to the response to ATP in WT. ATP (black) and its derivatives include modifications in the phosphoryl groups (green), the ribose moiety (orange), the adenine base (blue), a combination of two or more of these (white) or are dinucleotides (grey).
