Figure 2.
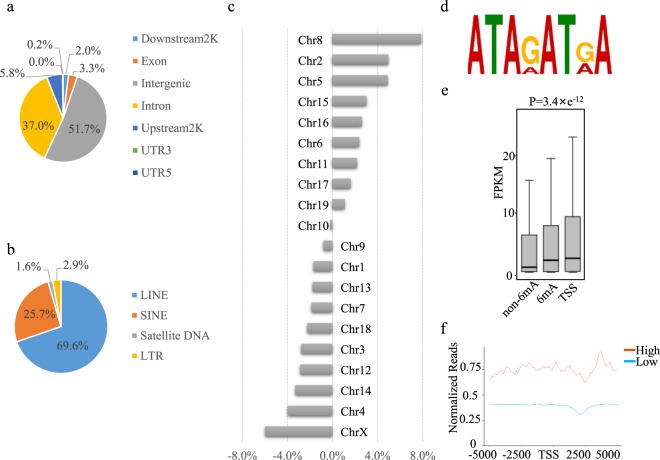
6mA-IP-seq and RNA-seq of mature adipocytes. (a) Genome-wide distribution of N6-adenine methylation. (b) Distribution profiles of 6 mA in transposon elements. (c) Chromosome-wide distribution of 6 mA. For each chromosome, a chromosome length ratio was calculated by dividing its length in nucleotide against the total length of the genome, a 6 mA ratio was calculated by dividing the number of its 6 mA sites against the number of the total 6 mA sites. Then, an 6 mA abundance index was calculated by subtracting the 6 mA ratio by its chromosome length ratio. (d) Sequence motifs of 6 mA sites. (e) Comparison of the median and interquartile range of gene expression between genes without 6 mA sites (Non-6mA), genes with 6 mA sites (6 mA) and genes with 6 mA sites around TSS region (TSS), in 3T3-L1 cell of Day(+4). (f) 6 mA profile around TSS region, for genes with high (FPKM > 50) and low (FPKM < 50) expression level. Reads densities were normalized by RPKM algorithm.

