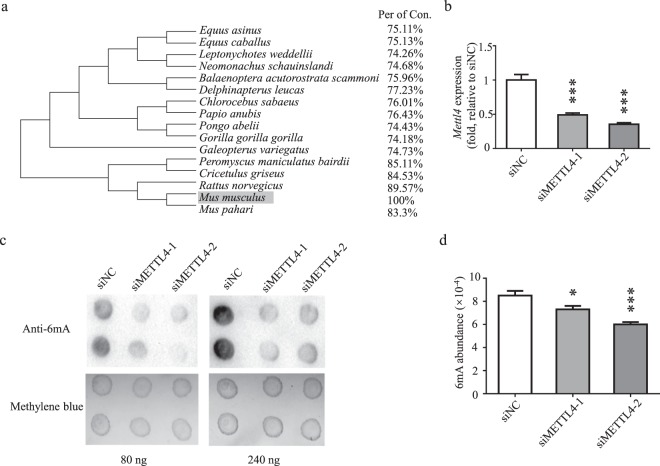
Figure 4.
Knock-down of Mettl4 leads to decreased 6 mA levels. (a) Phylogenetic tree analysis of METTL4 in mammals. (b) 3T3-L1 cells were transfected with Mettl4-targeting siRNAs. With the cells, gene expression of Mettl4 was determined by quantitative RT-PCR, in relative to control cells treated by a sequence-irrelevant siRNA. (c,d) Genomic 6 mA levels were determined by dot blot (c) and HPLC-MS/MS. Full-length blots are presented in Supplementary Fig. S5 (d). Data are analyzed by Student’s t-test and presented as mean ± s.d., n = 3 independent experiments. *P < 0.05; **P < 0.01; ***P < 0.001.

