Figure 7.
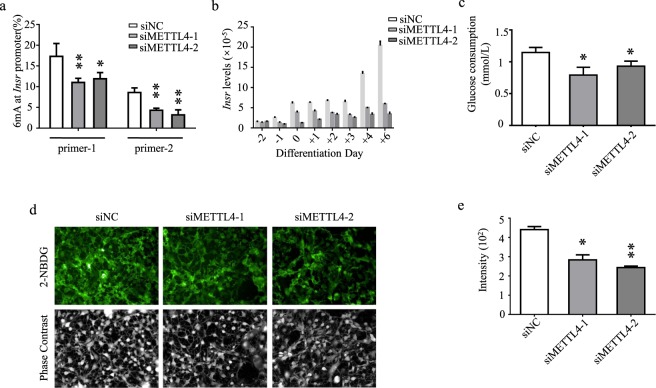
The effects of Mettl4 knockdown on glucose metabolism. (a) Promoter 6 mA abundance of Insr gene on day(+2) of the differentiation was determined by 6mA-IP-qPCR. (b) Expressional profiles of Insr in wild-type and Mettl4 knockdown cells. Gene expression levels were determined by quantitative RT-qPCR, in relative to that of β-actin. (c) Knockdown of Mettl4 led to decreased consumption of glucose. (d) Fluorescence images of 2-NBDG uptake. (e) Quantitative analyses of 2-NBDG uptake. Data are analyzed by Student’s t-test and presented as mean ± s.d., n = 3 independent experiments. *P < 0.05; **P < 0.01.

