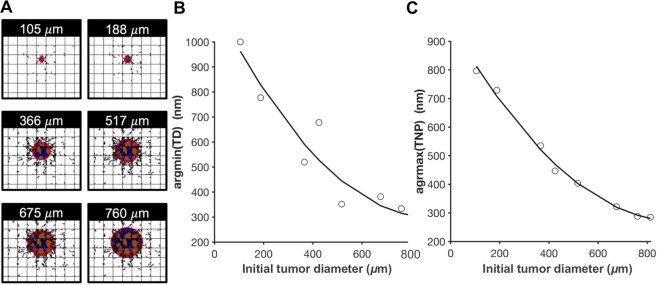
Figure 1.
Optimizing nanoparticle designs for tumors of different sizes. (A) Tumors of different sizes at which the treatment starts. Change in optimal nanoparticle diameters that (B) minimizes tumor size after one day of treatment and (C) maximizes percent accumulation of nanoparticles in tumor tissue as a function of tumor size at start of treatment. Black lines represent the second order polynomial fit obtained by minimizing the least linear square. Red: proliferating tumor tissue; blue: hypoxic tissue; brown: necrotic tissue. Orthogonal grid represents pre-existing capillary network surrounding the growing tumor. Irregular lines simulate capillary growth in response to a net balance of pro-angiogenic factors released by hypoxic tumor tissue.

