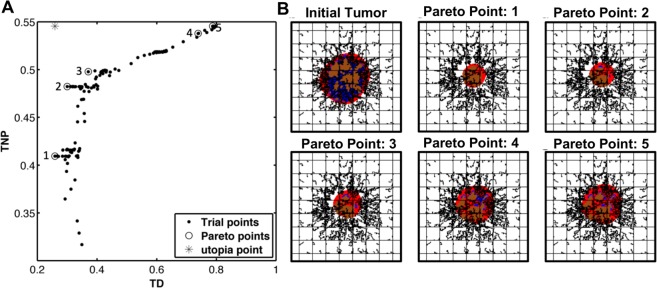
Figure 3.
Solution of the multiobjective optimization problem. (A) Trial points selected by MADS to generate the Pareto front. (B) Display of the tumor at treatment initiation and after treatment using the optimal designs identified (quantified in Table 2), respectively showing a decrease of 74%, 70%, 63%, 26% and 21% in tumor diameter ratio (TD). The corresponding nanoparticle accumulation in the treated tumors (TNP) is 41%, 48%, 50%, 54% and 55%, respectively. Colors are as in Fig. 1.

