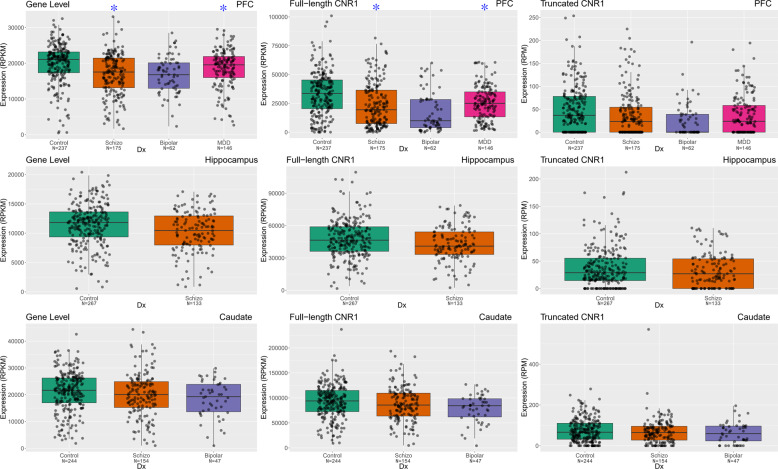
Fig. 2. The comparison of mRNA expression of CNR1 gene and CNR1 transcripts in human DLPFC, hippocampus and caudate.
The mRNA expression of CNR1 gene, full-length CNR1 transcript and 99 nt truncated CNR1 transcript was studied across four cohorts of subjects in DLPFC, two cohorts of subjects in hippocampus and three cohorts of subjects in caudate. The x-axis showed the different diagnostic groups: Control, nonpsychiatric control group; Schizo, patients with schizophrenia; Bipolar, patients with bipolar disorder; MDD, patients with major depression. The y-axis represents the relative expression quantities at gene level or transcript level in the DLPFC, hippocampus or caudate. Each dot represents a subject. Blue stars indicate patient groups with significantly differential expression compared with control group.

