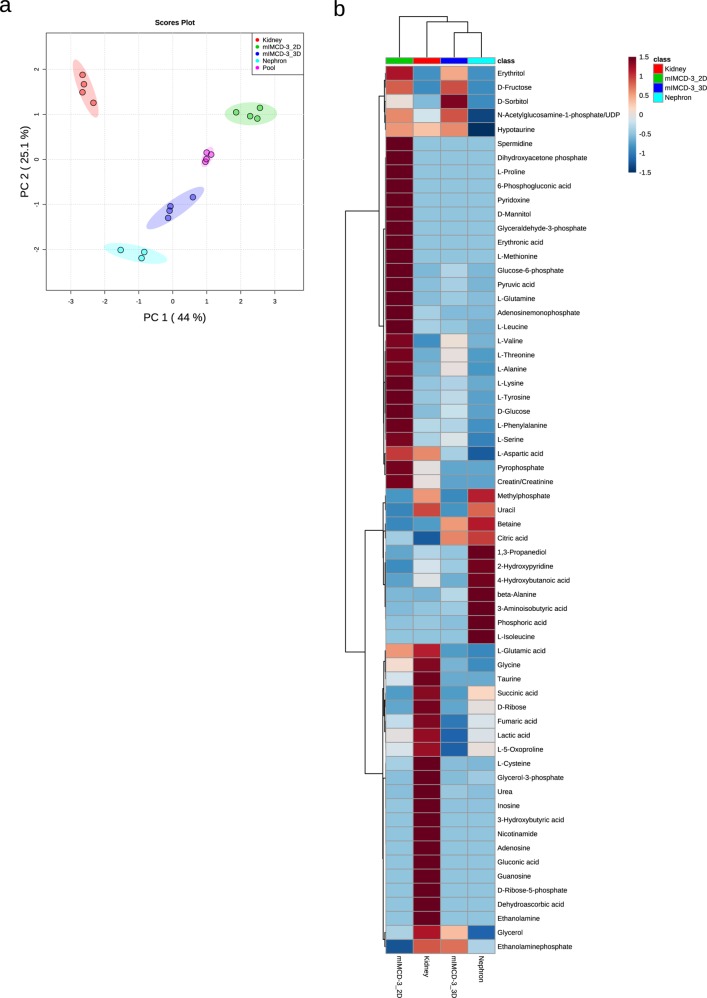
Fig. 3. The endometabolome of mIMCD3 cells and freshly isolated kidney cells.
a PCA of endometabolite profiling with PC1 against PC2. Red: whole kidney lysate, green: cells grown in 2D, blue: cells grown in 3D, turquoise: isolated distal tubules from perfused kidneys, and pink: pooled quality control sample. Replicates are highlighted as individual dots; shaded area shows the 95% confidence interval. b Heat map and cluster analysis of endometabolites. Range-scaled z-scores of annotated features with a q-value < 0.05 according to ANOVA and FDR correction. Differently abundant metabolite clusters after Pearson and Ward reflect the differences between cultured 2D or 3D grown mIMCD3 cells and kidney lysates. Green: 2D grown cells, red: whole kidney lysate, blue: 3D grown mIMCD3 cells, turquoise: isolated nephrons, n for nephrons = 3, n for 2D, 3D, and kidneys = 4.

