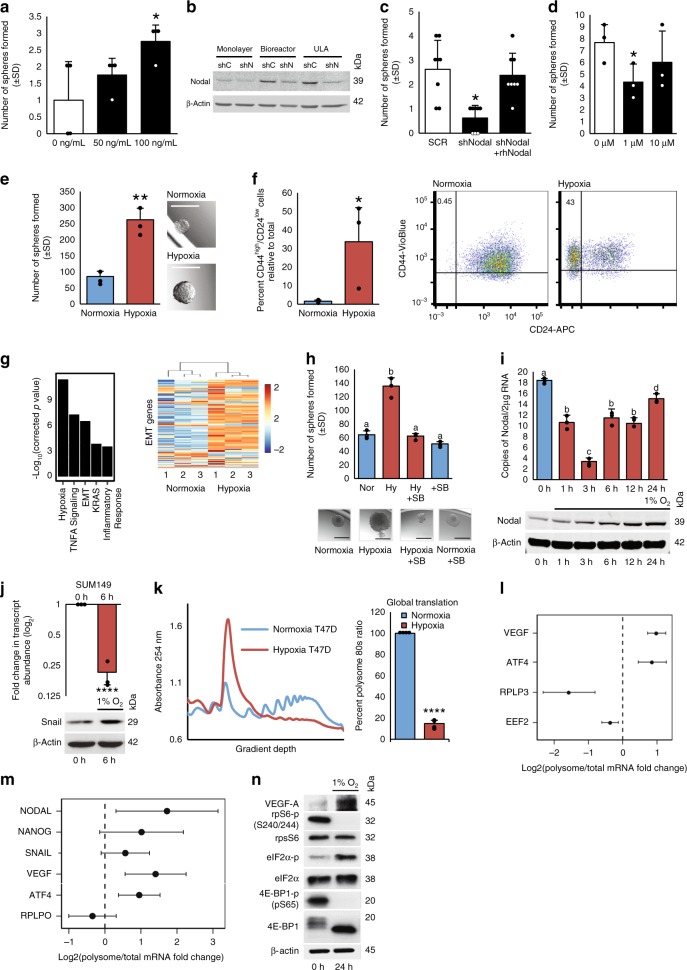
Fig. 1. Hypoxia-induced translational reprogramming promotes BCSC phenotypes.
a Mean number of spheres formed from T47D cells treated with rhNODAL (0, 50, 100 ng/mL) relative to untreated cells (n = 3). b NODAL immunoblots of MDA-MB-231 cells: 2D monolayer, 3D bioreactor, and tumorspheres grown in Ultra Low Attachment (ULA) plates. Cells expressed shRNA agianst NODAL (shN) or a control (shC) and β-actin is a loading control. Mean spheres formed from MDA-MB-231 c expressing NODAL shRNA with or without rhNODAL (100 ng/mL) or d exposed to SB431542 (1, 10 μM) (n = 3). e Mean spheres from 960 T47D cells pre-exposed to 24 h hypoxia or normoxia (n = 3) with representative images. Micron bars = 250 μm. f Mean percentage of CD44high/CD24low T47D cells following 24 h hypoxia or normoxia (n = 3). Representative scatterplots defining CD44 and CD24 subpopulations. g RNAseq gene set enrichment analysis from T47D cells cultured 48 h in normoxia or hypoxia. Heatmap of EMT genes demonstrating hypoxic up-regulation (n = 3). h Mean spheres formed from 960 T47D cells pre-exposed to 24 h hypoxia or normoxia ± SB431542 (10 μM) with representative images (n = 3). Micron bars = 500 μm. i Mean NODAL transcript copy number qRT-PCR vs. known standards and protein levels (immunoblot) in hypoxia-treated (0–24 h) T47D cells (n = 3). j SNAIL transcript mean log2-fold change (qRT-PCR) and protein levels (immunoblot) in hypoxia-treated SUM149 cells (0, 6 h) (n = 3). k Polysome profile and global translation in hypoxia versus normoxia in T47D cells. Mean percent polysome-associated mRNA (>3 ribosomes). l Mean log2-fold change of the ratio of polysome-associated EEF2, RPLPO, VEGF, and ATF4 mRNA levels in T47D cells used in k and m polysome-associated RPLPO, VEGF, ATF4, NANOG, SNAIL, and NODAL mRNA levels in H9 hESC cultured for 24 h in 1 versus 20% O2 (n = 3). n 4E-BP, rpS6, and eIF2α phosphorylation immunoblots from T47D cells used in k. 4E-BP1, rpS6, eIF2α, and β-actin-loading controls and hypoxia-positive control VEGF. Hypoxia denoted in red and normoxia blue. Data represents independent experiments. Error bars indicate mean ± SD. Two-sided t-test for paired samples. The asterisks denote p-values < *0.05, **0.01, ****0.0001. Multiple comparisons tested by ANOVA. The same letters indicate relationships with a p ≥ 0.05. Different letters indicate statistical differences (p < 0.05).

