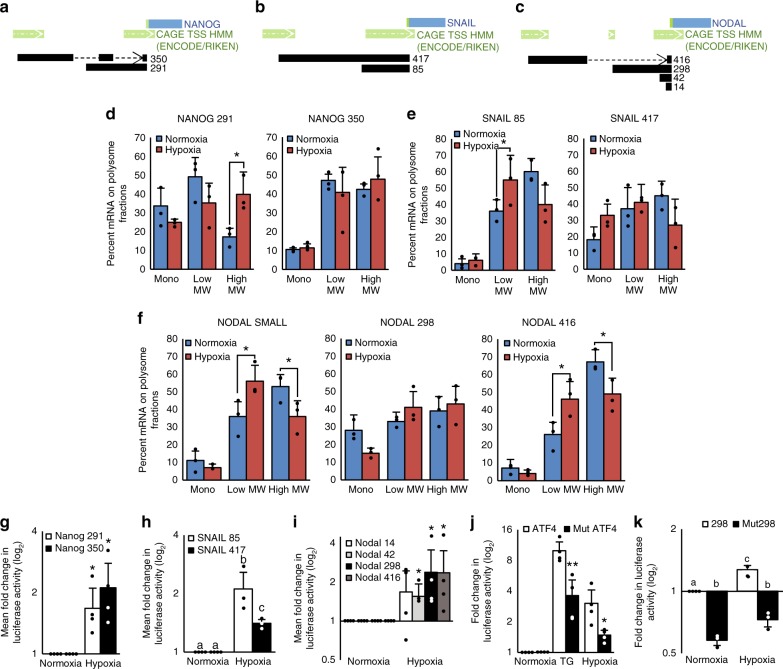
Fig. 2. Isoform-specific selective translation of BCSC-associated transcripts in hypoxia.
a–c Diagrams of the a NANOG, b SNAIL, and c NODAL gene loci showing multiple transcriptional start sites (dark green with white arrows) leading to multiple 5’UTR sequences (black). Dotted lines represent splicing events. The blue rectangles represent the ORFs and the bright green bar represents the translational start site. d–f mRNA isoforms of d NANOG, e SNAIL, and f NODAL associated with mononsomes, low MW polysomes and high MW polysomes extracted from MCF7 cells cultured for 24 h in hypoxia or normoxia. Bars represent the mean percent of transcript associated with each fraction in each condition ± SD (n = 3, NODAL n = 4). Lines and asterisk (*) indicate significant differences between conditions (p < 0.05). g–i Luciferase activity in cells transfected with p5′UTR firefly constructs harboring the various 5′UTRs of g NANOG (n = 4), h SNAIL (n = 3), or i NODAL (n = 4) and then exposed for 6 h to normoxia or hypoxia. Bars represent mean luciferase activity in hypoxia relative to normoxia ± SD. Different letters are statistically different in h and values indicated by an asterisk (*) in g and i are statistically different from control values but not from each other (p < 0.05). j Luciferase activity in cells transfected with p5′UTR firefly constructs harboring either the wild type or uORF1 mutated ATF4 5′UTR and then exposed for 6 h to normoxia, thapsigargin (TG; 0.1 μM), or hypoxia. Bars represent mean luciferase activity relative to cells exposed to normoxia ± SD. Values indicated by an asterisk (*) are statistically different from wild type 5′UTR (p < 0.02, n = 3). k Luciferase activity in cells transfected with p5′UTR firefly constructs harboring either the wild type or uORF mutated NODAL 298 5′UTR and then exposed for 6 h to normoxia or hypoxia. Bars represent mean luciferase activity relative to cells exposed to normoxia ± SD (n = 3). Error bars indicate mean ± SD. Two-sided t-test for paired samples. The asterisks denote p-values < *0.05, **0.01. Multiple comparisons tested by ANOVA. The same letters indicate relationships with a p ≥ 0.05. Different letters indicate statistical differences (p < 0.05).

