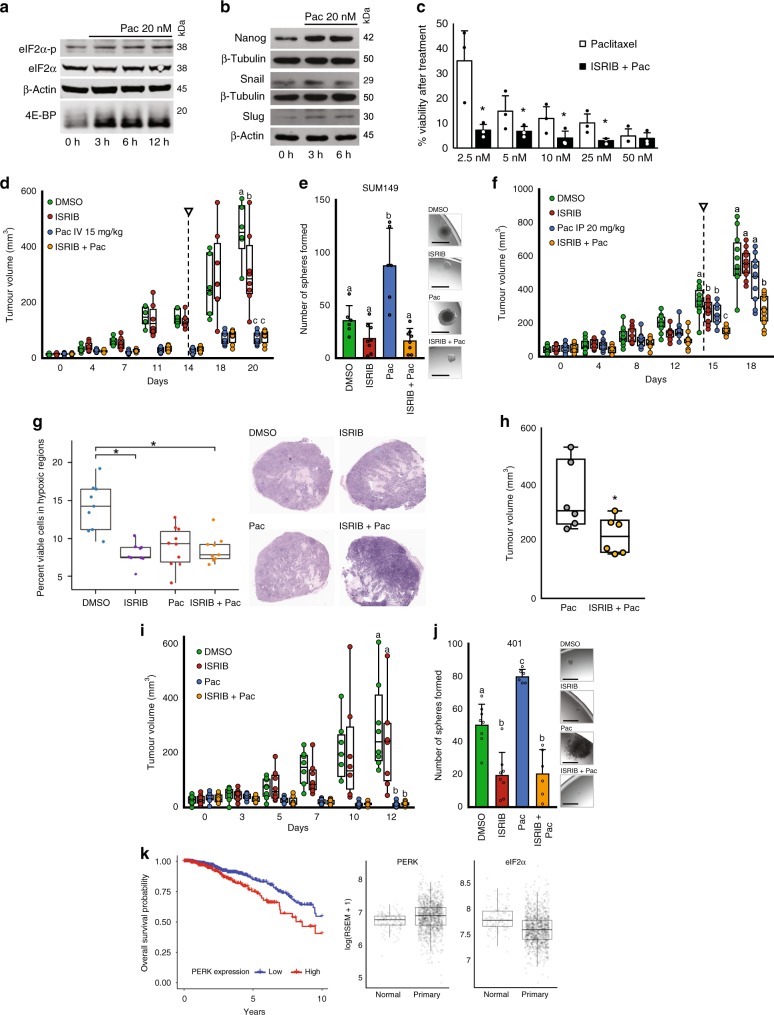
Fig. 6. ISRIB mitigates therapy-induced BCSCs and improves efficacy of paclitaxel.
a eIF2α-p, eIF2α, and 4E-BP1 immunoblots from 0 to 12 h paclitaxel (20 nM)-treated T47D cells (n = 3). b Immunoblots of NANOG, SNAIL, and SLUG from 0, 3, or 6 h paclitaxel (20 nM) treated T47D cells (n = 3). c Mean percent viability of paclitaxel (2.5–50 nM)-treated T47D cells in the presence or absence of ISRIB (10 nM) (p < 0.05, n = 3). d Mean SUM149 tumor volumes in mice treated every second day for 2 weeks (DMSO, ISRIB (2.5 mg/kg IP), paclitaxel (15 mg/kg IV), or paclitaxel (15 mg/kg IV) + ISRIB (2.5 mg/kg IP)). Arrow indicates treatment cessation (p < 0.01, treatment n = 8, DMSO n = 6). e Mean sphere counts from 96,000 viable SUM149 cells dissociated from endpoint tumors in d (n = 6) with representative images. Micron bars = 250 μm. f Mean SUM149 tumor volumes in mice treated every second day for 2 weeks (DMSO, ISRIB (2.5 mg/kg IP), paclitaxel (20 mg/kg IP), or paclitaxel (20 mg/kg IP) + ISRIB (2.5 mg/kg IP)). Arrow indicates treatment cessation (p < 0.01, n = 10). g Quantification of viable cells within necrotic areas of H&E-stained SUM149 tumors from f (p < 0.01, n = 7) with representative images. h Mean MDA-MB-231 tumor volumes of mice given 2 weekly paclitaxel (15 mg/kg IV), or paclitaxel (15 mg/kg IV) + ISRIB (2.5 mg/kg IP) treatment. i Mean PDX401 tumor volumes in mice receiving the treatment from d (n = 6). j Mean sphere counts from 96,000 PDX401 cells dissociated from endpoint tumors from i (n = 6) with representative images. Micron bars = 250 μm. k Kaplan–Meier plot showing that low PERK expression correlates with survival (HR 1.80 (1.24–2.62), p = 0.0019). RNAseq expression of PERK (eIF2αK3) transcript in tumors relative to normal breast tissue (normal, n = 113; tumor, n = 1062; PERK p = 1.52 × 10⁻¹⁵, eIF2a p = 1.87e−10). Data represents independent experiments. Error bars indicate mean ± SD. Box and whisker plot represents median, interquartile range (IQR), whiskers extend to maximum and minimum. Two-sided t-test for paired samples. The asterisks denote *p-values < 0.05. Multiple comparisons tested by ANOVA. The same letters indicate relationships with a p ≥ 0.05. Different letters indicate statistical differences (p < 0.05).

