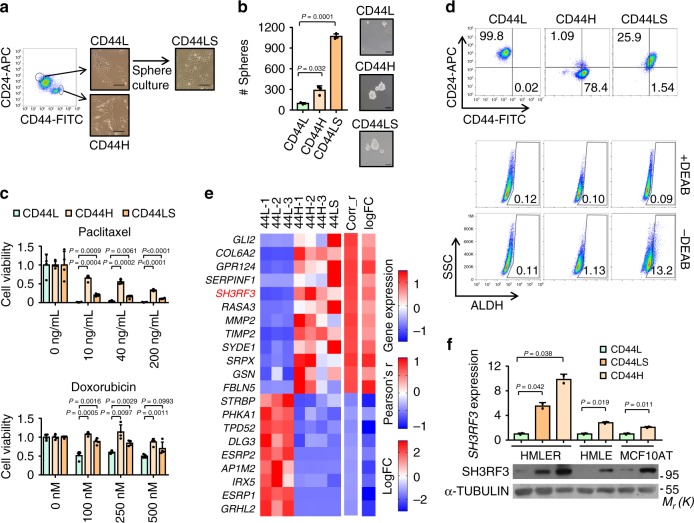
Fig. 1. SH3RF3 expression is associated with BCSC properties.
a Flow chart and representative images of HMLER subline derivation. Scale bar, 100 μm. b Quantitation (n = 3 culturing experiments) and representative images of tumorspheres in HMLER sublines. Scale bar, 100 μm. c MTT assays of HMLER sublines after paclitaxel (0–200 ng/mL) and doxorubicin (0–500 nM) treatment in various concentrations (n = 4 treatment experiments). d Flow cytometry analyses of CD44+CD24− and ALDH+ CSCs in HMLER sublines. Numbers in the cytometry charts indicate the percentages of corresponding subpopulations. e Genes associated with CSC properties in clinical tumors and HMLER sublines. Heatmap showed their expression in HMLER sublines, Pearson’s r correlation to CSC signature in TCGA tumors (Corr_r) and log-fold changes of expression in tumorspheres versus primary tumors (logFC). f SH3RF3 expression in different sublines derived from HMLER, HMLE and MCF10AT (n = 3 cell culturing). Data represent mean ± SD. Statistical significance was determined by two-tailed unpaired t-test (b, c, and f). The experiments in (b) and (f) were repeated three times independently with similar results, and the data of one representative experiment are shown. Source data are provided as a Source data file.

