Figure 8.

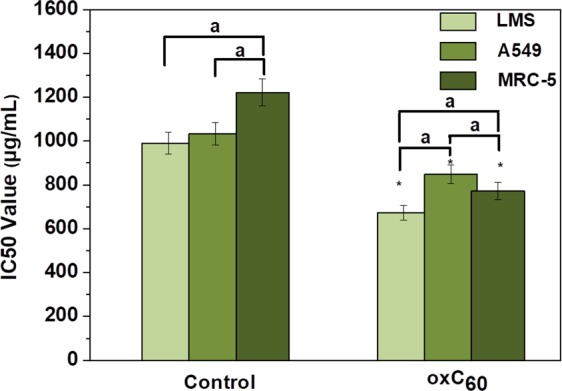
IC50 values in μg/mL of oxC60 on LMS, A549 and MRC-5 cells. *p < 0.05, statistical significant difference compared to the control (solvent); ap < 0.05, statistical significant difference between the cell lines within the treatment group.

IC50 values in μg/mL of oxC60 on LMS, A549 and MRC-5 cells. *p < 0.05, statistical significant difference compared to the control (solvent); ap < 0.05, statistical significant difference between the cell lines within the treatment group.