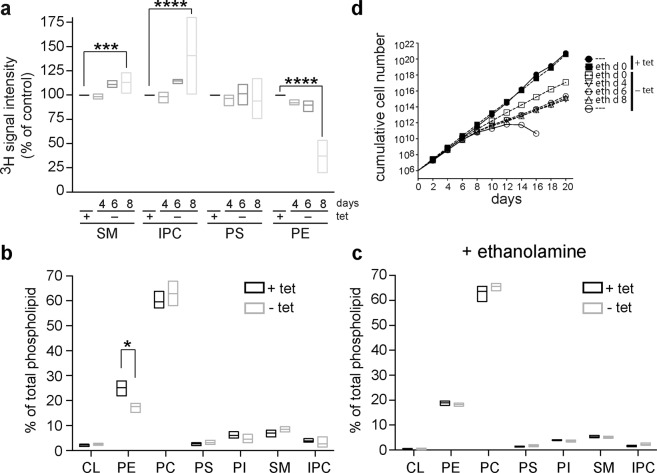
Figure 4.
Alterations in phospholipid levels after depletion of TbSpl expression. (a) Analysis of de novo phospholipid synthesis. TbSpl knockout parasites were cultured in the presence or absence of tetracycline for a total of 4, 6, and 8 days and labeled with [3H]-serine for the last 24 h. Lipids were extracted, separated by one-dimensional TLC, and quantified by radioisotope scanning. Box plots of mean values (horizontal line) and the min-max range from three independent experiments are shown. ***p < 0.001; ****p < 0.0001. (b) and (c) Analysis of total glycero- and sphingophospholipid levels. Phospholipids were quantified by phosphorus determination after two-dimensional thin layer chromatography. In (c), parasites were treated with 50 µM ethanolamine starting from day 0 of TbSpl depletion. The data represent box plots of mean values (horizontal line) and min-max ranges from at least three independent experiments. The asterisks indicate significant differences (p < 0.05). (d) TbSpl KO parasites were cultured in the absence (−tet) or presence (+tet) of tetracycline. 50 μM ethanolamine was added to the medium starting from day 0, 4, 6 or 8 as indicated in the legend. The data represent mean values from two independent experiments.

