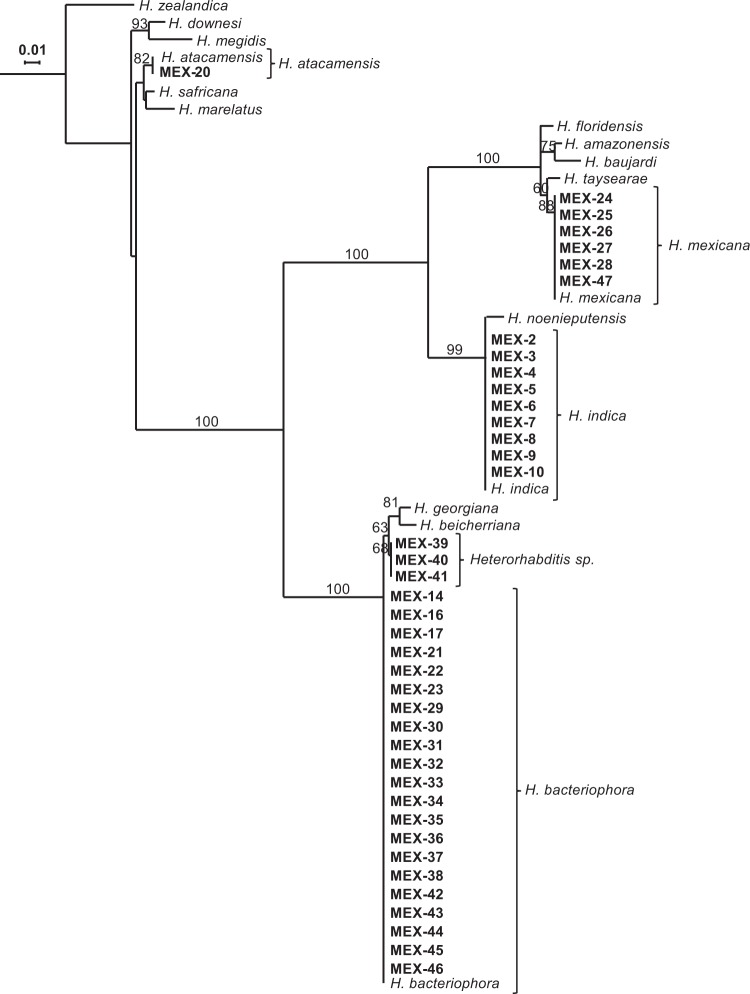
Figure 2.
Maximum-likelihood phylogenetic tree of Heterorhabditis nematodes based on 18S ribosomal RNA gene sequences. The evolutionary distances were computed using the Hasegawa-Kishino-Yano model. The tree with the highest log likelihood (−3422.19) is shown. Numbers at nodes represent bootstrap values higher than 70% based on 100 replications. The rate variation among sites was modeled with a gamma distribution (5 categories (+G, parameter = 0.4803)). Bar represents 0.01 nucleotide substitutions per sequence position. Accession numbers of the gene sequences used for the reconstructions and those obtained in this study are available in Tables S1 and S2, respectively.

