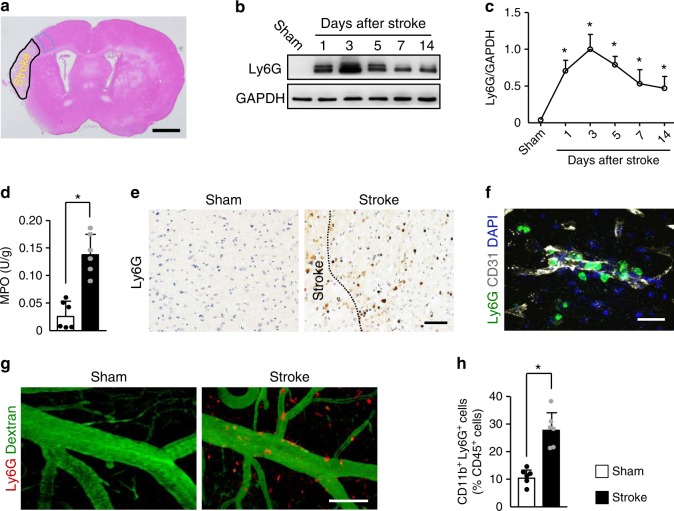
Fig. 1. Neutrophils accumulate in the brain during all stages of ischemic stroke.
a Hematoxylin and eosin-stained coronal section shows the zone (broken blue line) used for measurements of IgG extravasation, capillary length, and in-vivo multiphoton microscopy in the peri-infarct cortical areas. Bar = 1 mm. Independent experiments are repeated at least three times. b, c Representative immunoblots of the time course of neutrophils appearance (b) and quantification of the amount of neutrophil (c) in the peri-infarct cortex of mice subjected to stroke, compared with sham-operated mice (n = 5). One-way ANOVA test was applied with *P < 0.0001 (Sham vs. 1d), *P < 0.0001 (Sham vs. 3d), *P < 0.0001 (Sham vs. 5d), *P = 0.0003 (Sham vs. 7d), *P = 0.0015 (Sham vs. 14d). d Quantification of MPO activity in the brain of mice at 3 days after stroke or sham operation (n = 6), unpaired two-tailed Student’s t-test was applied with *P = 0.0001. e Representative images of Ly6G-positive neutrophils in the peri-infarct cortex of mice at 3 days after stroke, compared with sham-operated mice. Bar = 50 μm. Independent experiments are repeated at least three times. f Representative confocal images of Ly6G-labeled neutrophils (green) and CD31-positive microvessels (white) in the peri-infarct cortex of mice at 3 days. Nuclei were visualized with Hoechst. Neutrophils were observed within brain vessels and migrated into the parenchyma. Bar = 40 μm. Independent experiments are repeated at least three times. g Representative in-vivo multiphoton microscopy images of neutrophils (red) and cerebral angiopathy (green) in the peri-infarct cortex of mice at 3 days. Neutrophils were localized in brain vessels and the parenchyma. Blood vessels (green) were labeled by intravenous injection of FITC-dextran (MW = 2000,000 Da). Neutrophils (red) were labeled by intravenous injection of PE-conjugated monoclonal Ly6G antibody. Bar = 100 µm. Independent experiments are repeated at least three times. h Flow cytometric quantification of neutrophils (CD11b+Ly6G+ cells) in peripheral blood at 3 days after stroke, expressed as percentage of total leukocytes (CD45+ cells) (n = 6), unpaired two-tailed Student’s t-test was applied with *P = 0.0001. Data are presented as mean ± SD. Source data underlying graph b–d and h are provided as a Source Data file.

